Parameter Monitoring (Waveforms) Operations
5 - 22 046-004667-00 A7™ Operating Instructions
CO
2
vs. Time
The Y-axis of the CO
2
vs. Time waveform is labeled CO
2
. The unit of measure is mmHg, kPa, or %.
The Y-axis automatically adjusts the scales. Though the X-axis is not labeled, it represents a time
scale of 0 to 15 seconds.
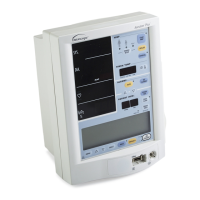
The N
2
O vs. Time waveform is displayed in the waveform area.
FIGURE 5-25 Example Simulated N
2
O vs. Time Waveform (available with the AG module)
N
2
O vs. Time
The Y-axis of the N
2
O vs. Time waveform is labeled N
2
O . The unit of measure is %. You can adjust
the scales of the Y-axis (see “Gas Scales” on page 3-40). Though the X-axis is not labeled, it
represents a time scale of 0 to 15 seconds.
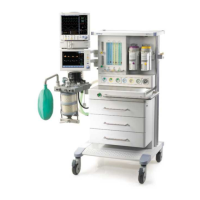
O
2
vs. Time waveform is displayed in the waveform area.
FIGURE 5-26 Example Simulated O
2
vs. Time Waveform (available with the AG module)
O
2
vs. Time
The Y-axis of the O
2
vs. Time waveform is labeled O
2
. The unit of measure is %. You can adjust the
scales of the Y-axis (see “Gas Scales” on page 3-40). Though the X-axis is not labeled, it represents
a time scale of 0 to 15 seconds.
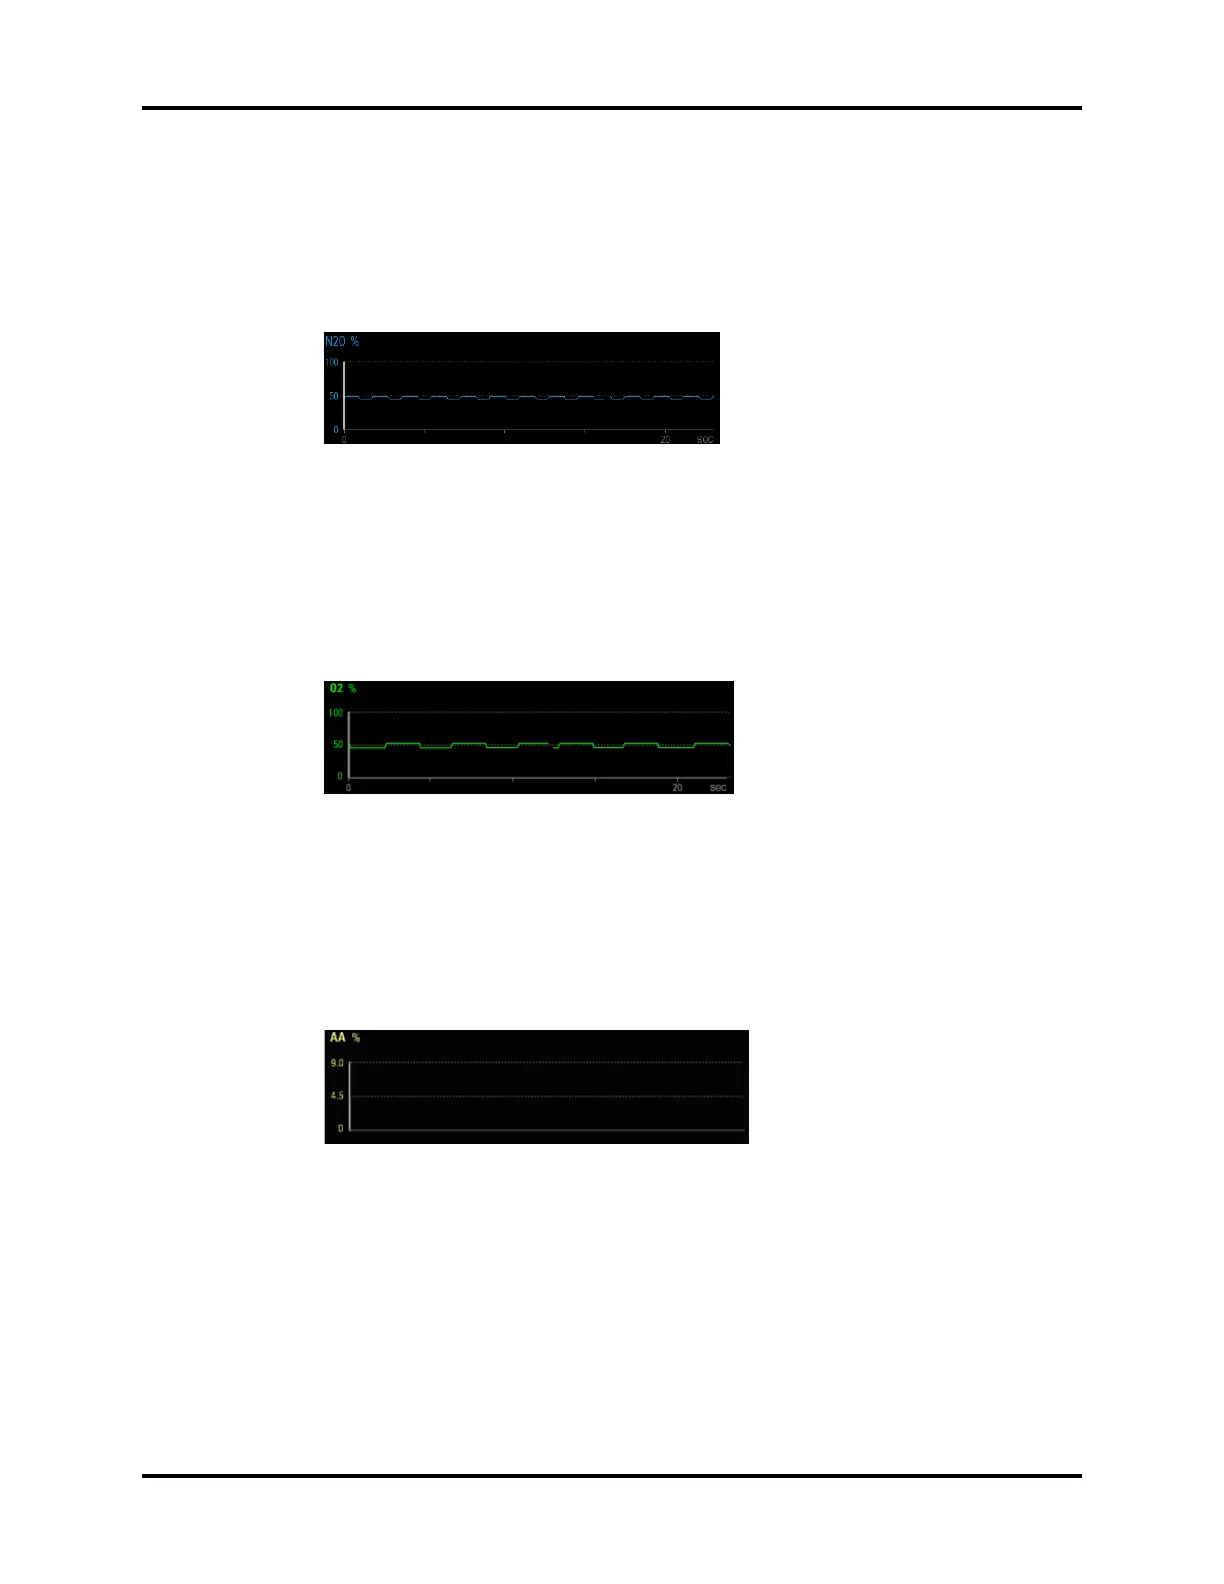
AA vs. Time waveform is displayed in the waveform area.
FIGURE 5-27 Example Simulated AA vs. Time Waveform (available with the AG module)