A7™ Operating Instructions 046-004667-00 5 - 21
Operations Parameter Monitoring (Waveforms)
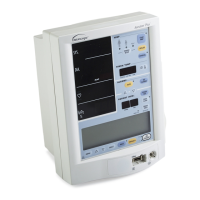
The Flow vs. Time waveform displays in the waveform area.
FIGURE 5-22 Example Simulated Flow vs. Time Waveform
Flow vs. Time
The Y-axis of the Flow vs. Time waveform represents Flow. The unit of measure is L/min. The Y-
axis automatically adjusts the scales. Though the X-axis is not labeled, it represents a time scale of
0 to 15 seconds.
NOTE: The purple in the waveform means it is a triggered breath.
5.10.3 Volume Waveform
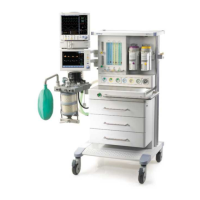
The Volume vs. Time waveform displays in the waveform area. The default waveform displayed
on the waveform ares is Flow vs. Time waveform. Select Setup softkey > Display tab >
Waveform Display button and select Volume to set the waveform display.
FIGURE 5-23 Example Simulated Volume vs. Time Waveform
Volume vs. Time
The Y-axis of the Volume vs. Time waveform is labeled Volume . The unit of measure is ml. The Y-
axis automatically adjusts the scales. Though the X-axis is not labeled, it represents a time scale of
0 to 15 seconds.
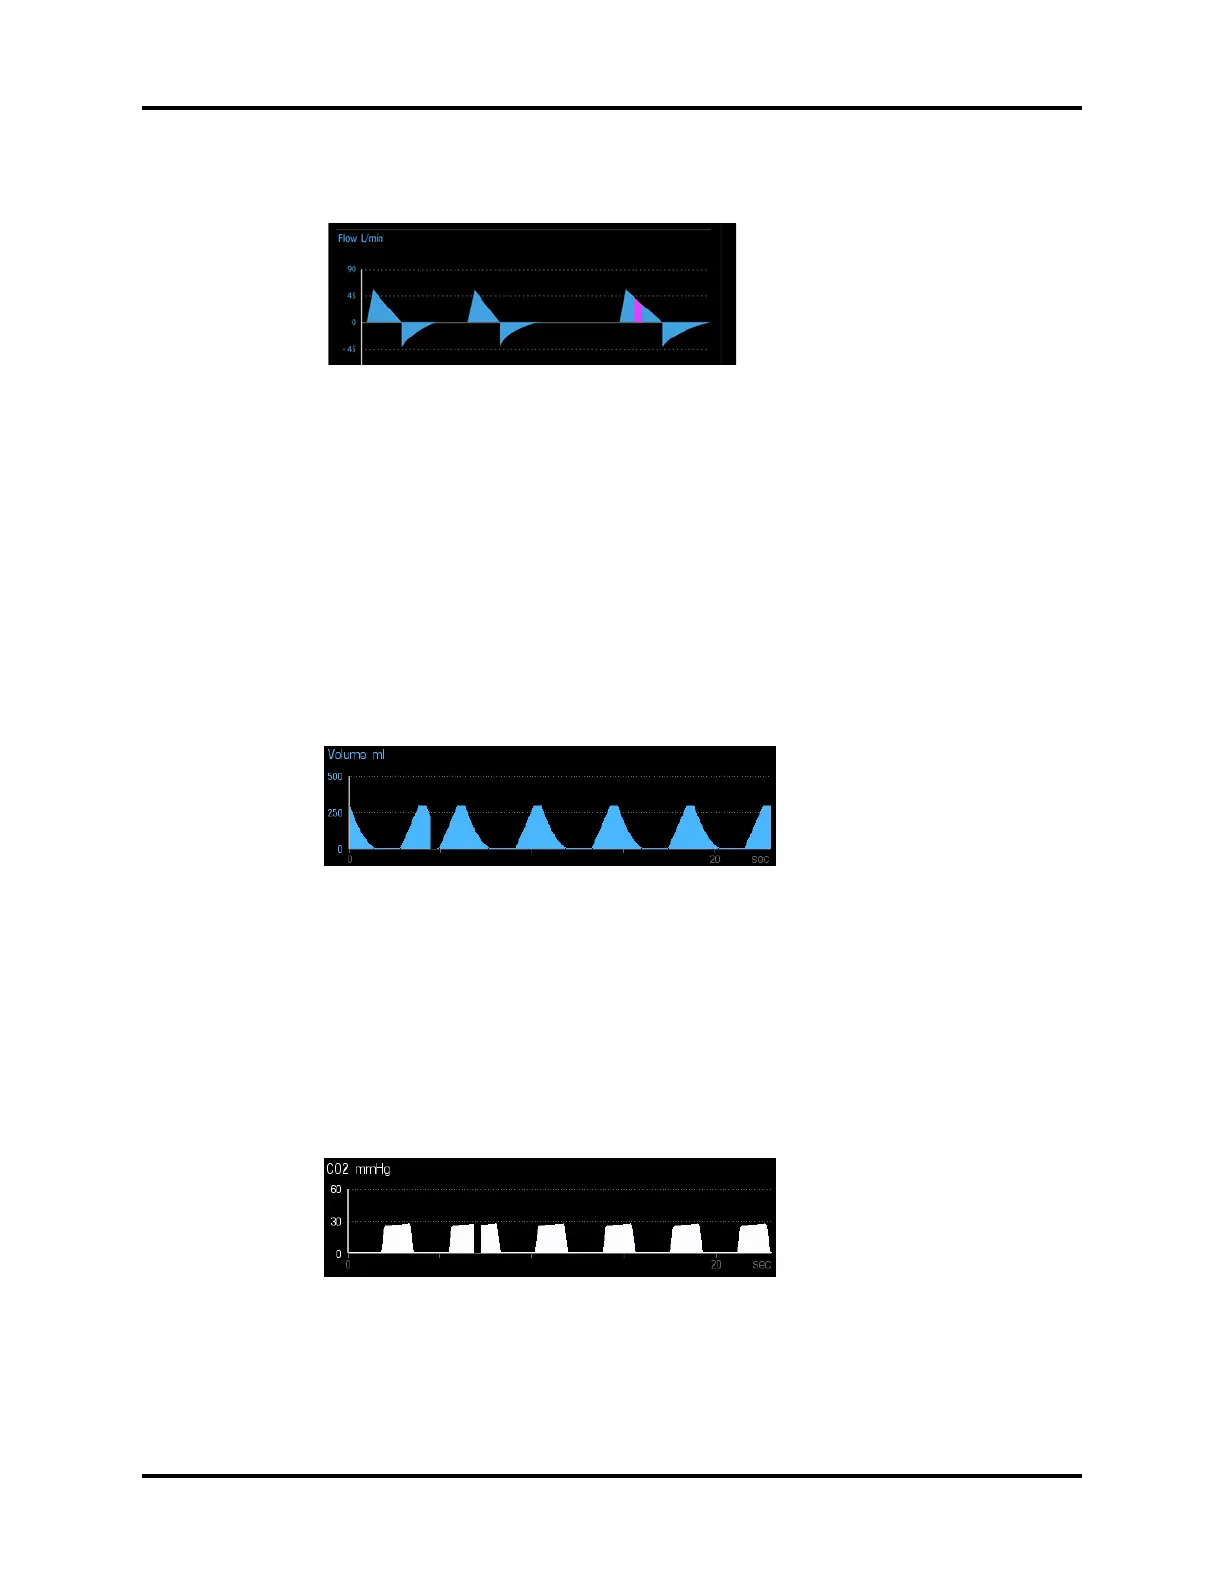
5.10.4 Gas Waveform
The CO
2
vs. Time waveform displays in the waveform area.
FIGURE 5-24 Example Simulated CO
2
vs. Time Waveform