System Softkeys System Interface
3 - 32 046-004667-00 A7™ Operating Instructions
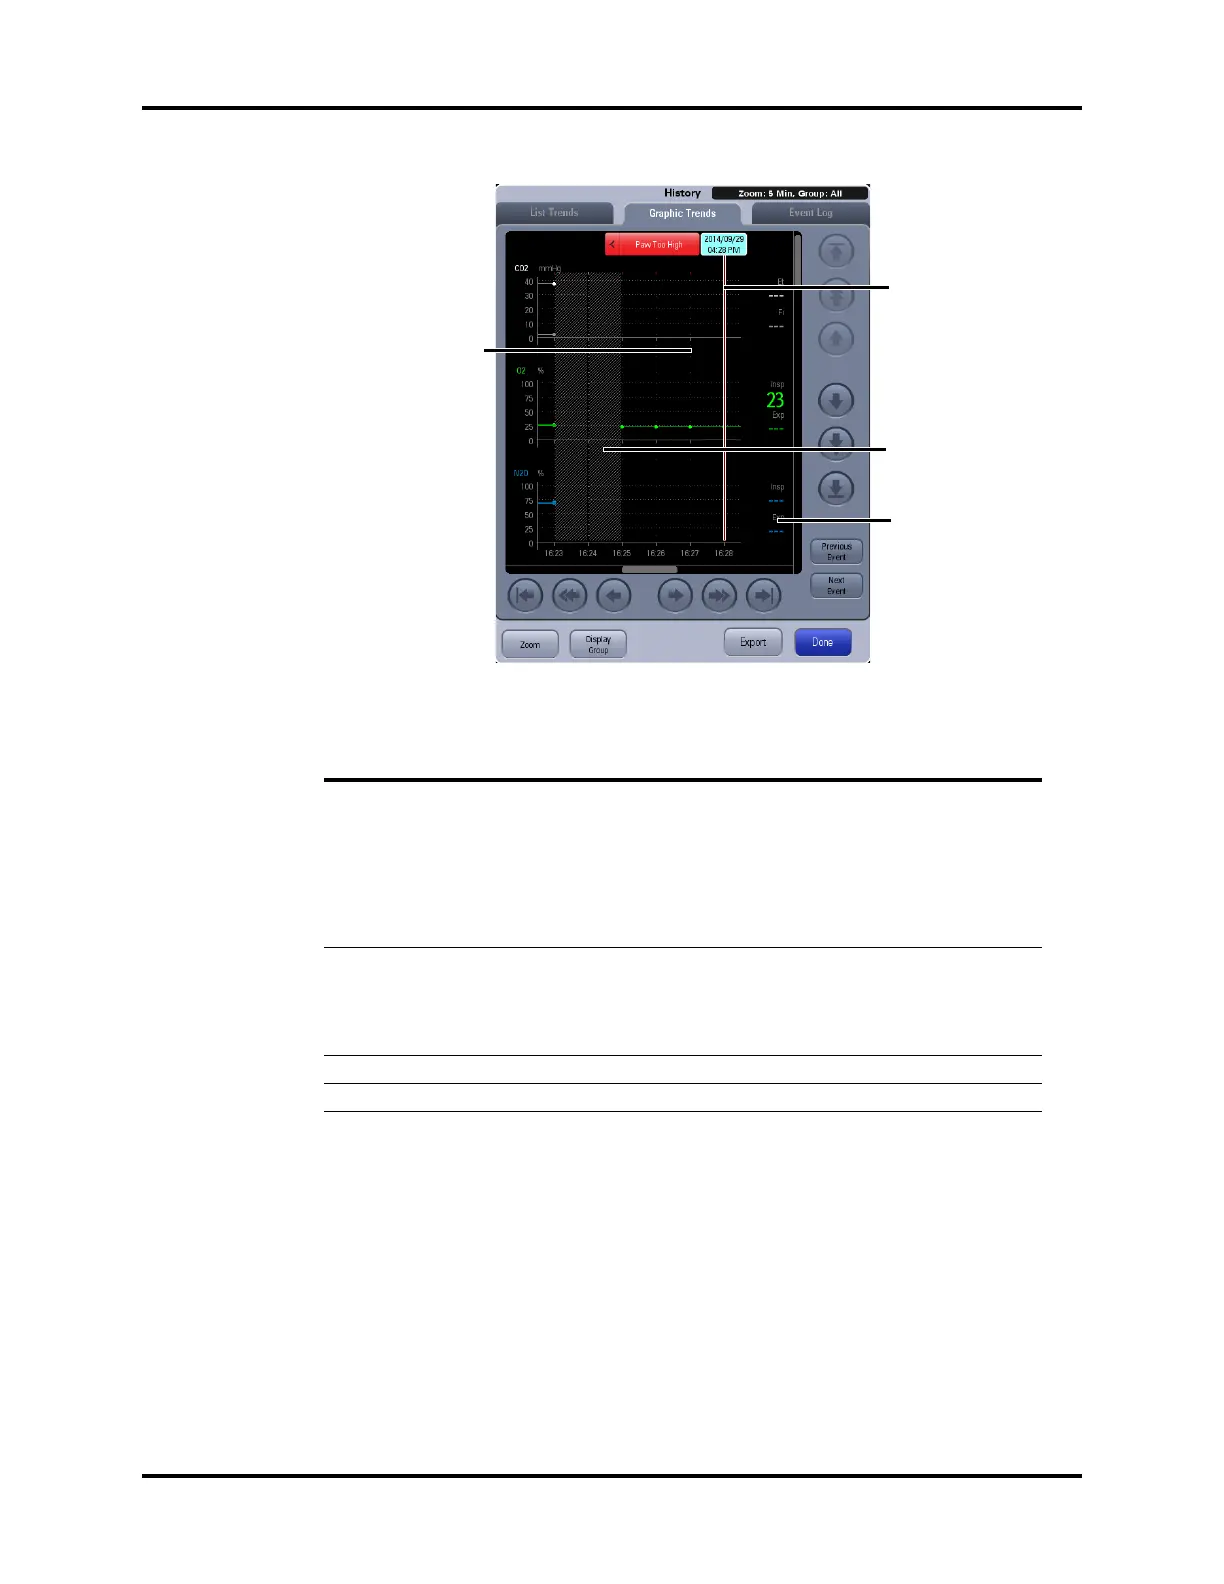
FIGURE 3-41 Graphic Trends
NOTE: The Graphic Trends will be cleared after the anesthesia machine
undergoes power failure or is turned off.
NUMBER DESCRIPTION
1 Event marker. The dotted,colored line indicates an event occurred at that time.
Events could be any of the following: end case, capture an event or a
physiological alarm occurrence. For end case or capture an event, the dotted line
is white. For physiological alarm occurrence, the dotted line is in the same color as
alarm. If multiple events occurred, dotted line is in same color as the event of the
highest alarm level. The event level can be specified as: high alarm level event >
medium alarm level event > low alarm level event > capture event > end case
event.
2 Current cursor. The corresponding time displays above the cursor. If alarms or
events occurred at that time, the corresponding alarm information or events will
also display above the cursor (hereinafter referred to as event bubble). Clicking on
the event bubble will cause the event log tab (see FIGURE 3-42) to open on that
specific event.
3 An end case event occurred during this period.
4 The parameter data of the time indicated by cursor.
TABLE 3-5
4
2
3
1