10 Calculation Methods 10-13
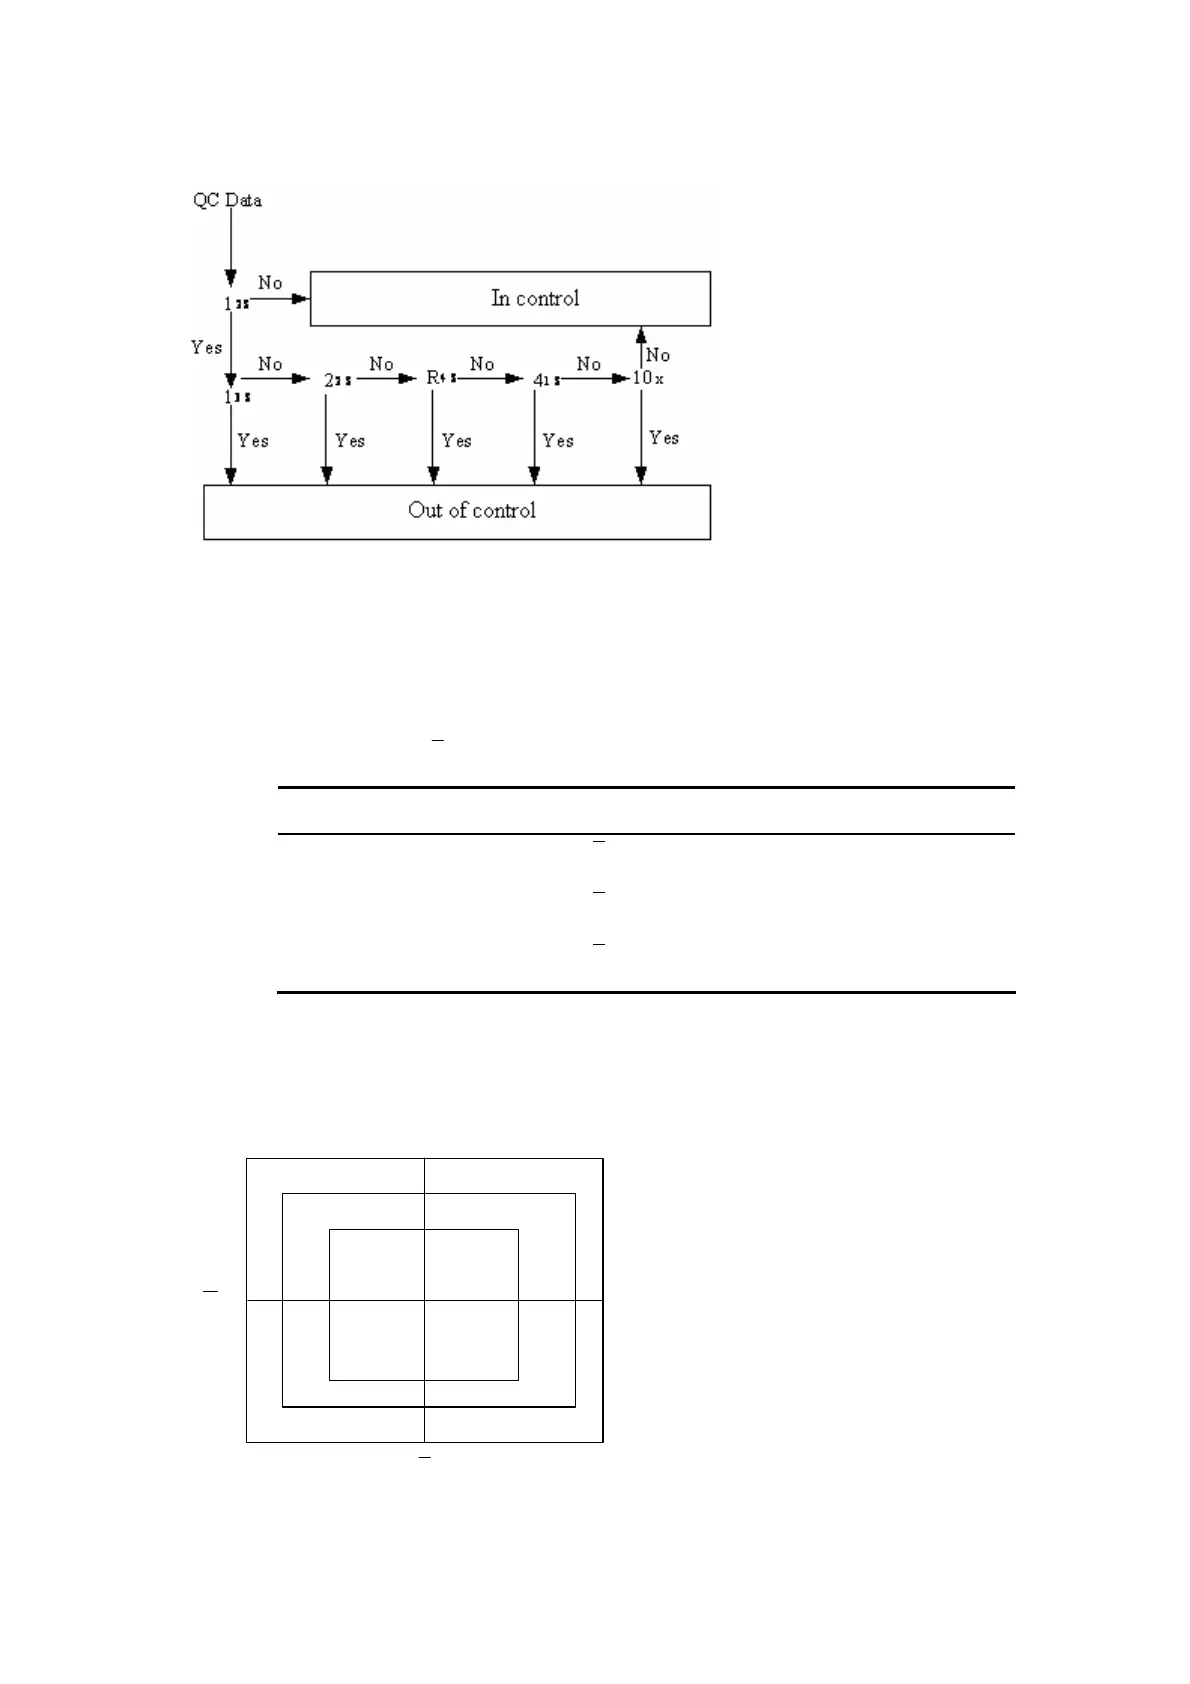
Figure 10-10 Westgard Multi-rule QC Conclusion Flow
For several controls, the conclusion logic is similar to the above condition, except for
multiple continuous QC data, which should be combined simultaneously.
10.2.5.2 Cumulative Sum Check
Regarding different requirements to the QC result, cumulative sum check usually adopts
three controlling methods, which are mainly used to monitor the systematic error of the
testing methods. Where,
- average value, SD - standard deviation.
Controlling Methods Threshold (k) Limit(h)
CS-(1.0SD: 2.7SD)
±1.0SD
±2.7SD
CS-(1.0SD: 3.0SD)
±1.0SD
±3.0SD
CS-(0.5SD: 5.1SD)
±0.5SD
±5.1SD
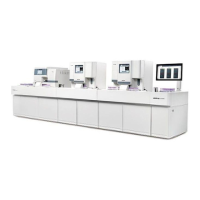
10.2.5.3 Twin-plot
In the system, Twin-plot, which has no detailed rules, is present only as a whole chart to
help you make a QC conclusion.
Figure 10-11 Twin-plot
+2SD
Χ
-2SD
-3SD
+3SD
Y
+2SD +3SD-2SD-3SD
The chart can sensitively indicate the systematic errors and random errors.