4-8
time moments are already saved, when [Save] is selected again, the system automatically
clears the oldest reference loops except the loops being viewed and saves the current loops as
reference loops.
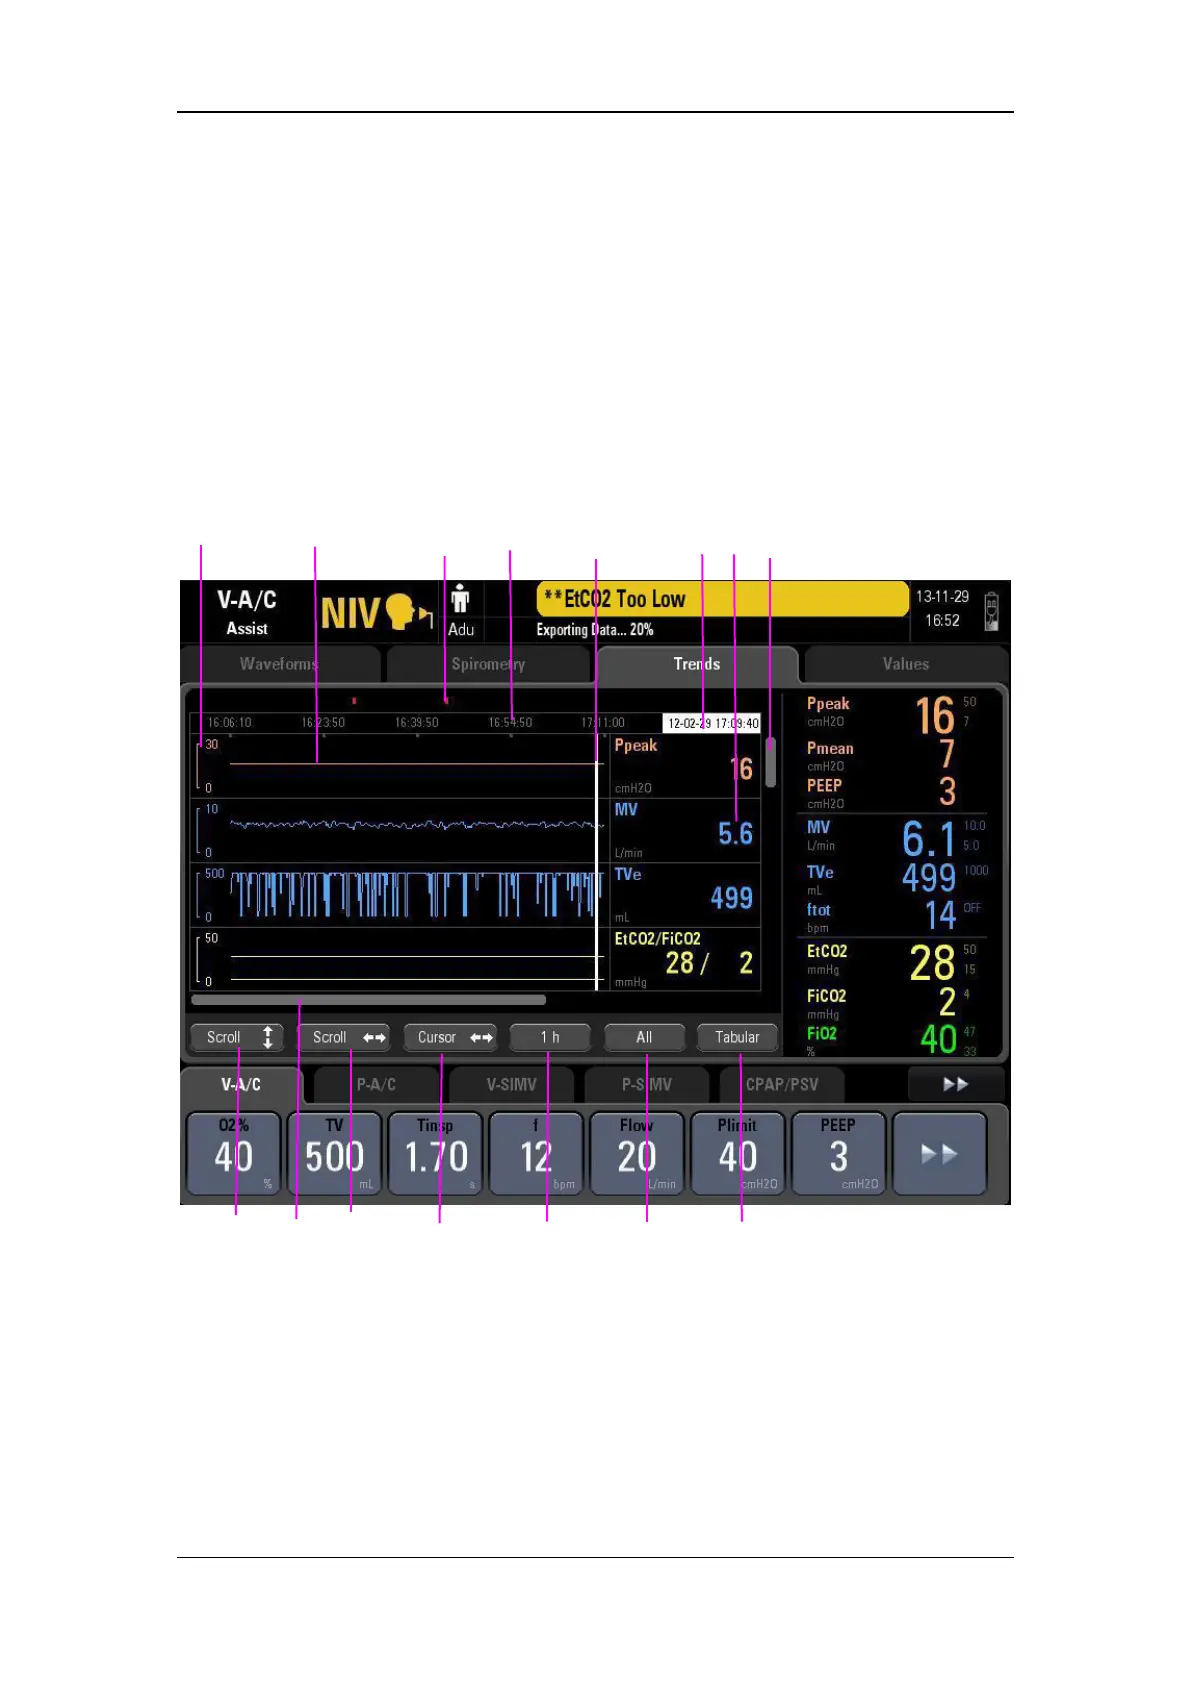
4.4 Graphic Trend Screen
Graphic trend depicts the changes in parameter measured values in graphic form over a
specific period of time. Each point on the curved line represents the physiological parameter
value at each time moment.
You can access the following graphic window by selecting [Trends] and/or selecting the
button for switching between [Tabular] and [Graphic].
1. Graphic scale
2. Graphic trend
3. Event mark field, displaying event marks in the current trend window. Alarm events of
different priorities are represented by different mark colors. Red event mark indicates a
high priority alarm event and yellow a medium or low priority alarm event.
4. Time scale axis, displaying time scale information on the time axis.
1
2
3
7
9
6
15
12
13 11
4
10
5
8