4-10
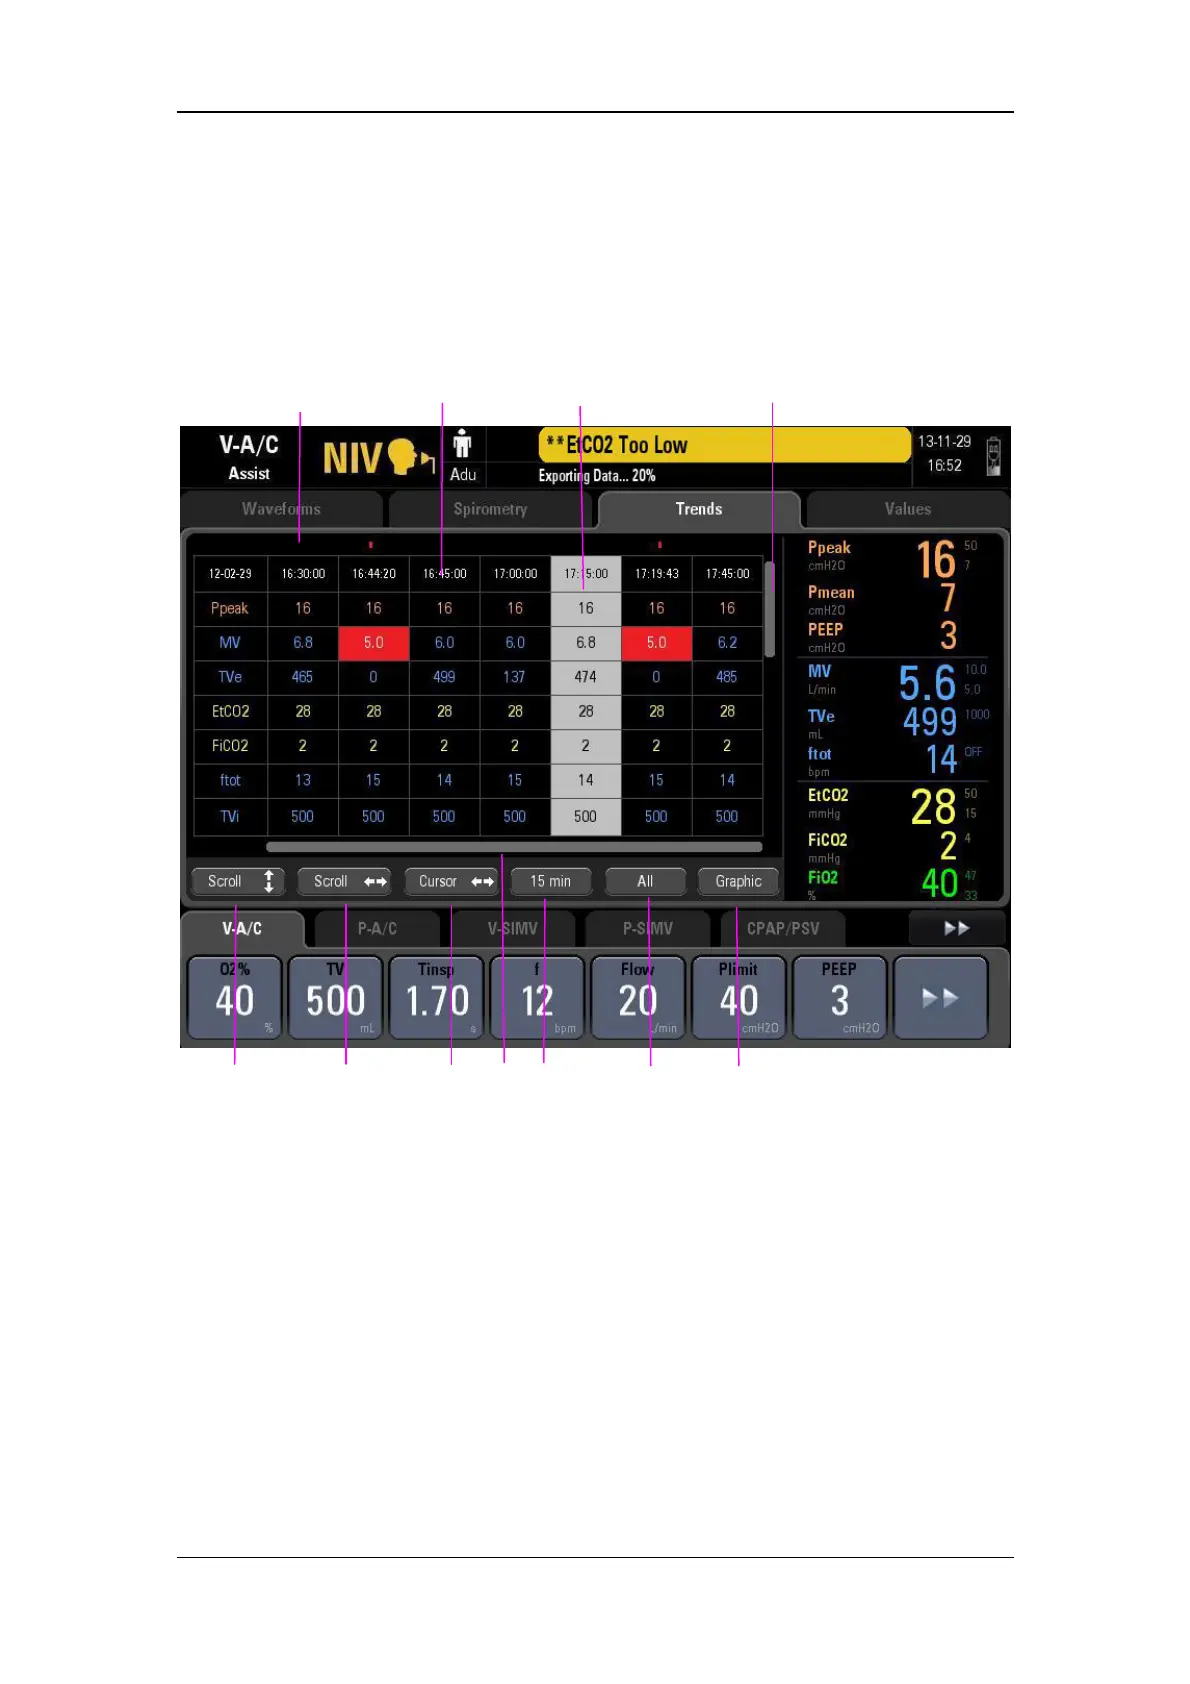
4.5 Tabular Trend Screen
Tabular trend depicts the changes in parameter measured values in tabular form over a
specific period of time.
You can access the following tabular window by selecting [Trends] and/or selecting the
button for switching between [Tabular] and [Graphic].
1. Event mark field, displaying event marks in the current trend window. Alarm events of
different priorities are represented by different mark colors. Red event mark indicates a
high priority alarm event and yellow a medium or low priority alarm event.
2. Time field, displaying the time corresponding to the cursor
3. Cursor column, displaying parameter values measured at the time corresponding to the
cursor. Alarm events of different priorities are represented by different background
colors. Red event mark indicates a high priority alarm event and yellow a medium or
low priority alarm event.
4. Vertical scroll bar, indicating the position of the currently displayed parameter in the
entire parameter sequencing.
5. Button for switching between graphic trend and tabular trend
1
2
3
4
587 6
11
10
9