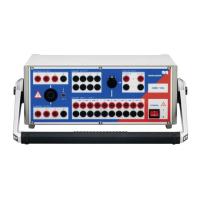
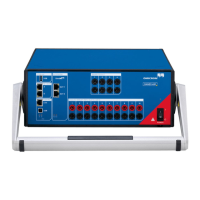
OMICRON 121
Test cards for Advanced CT Test mode
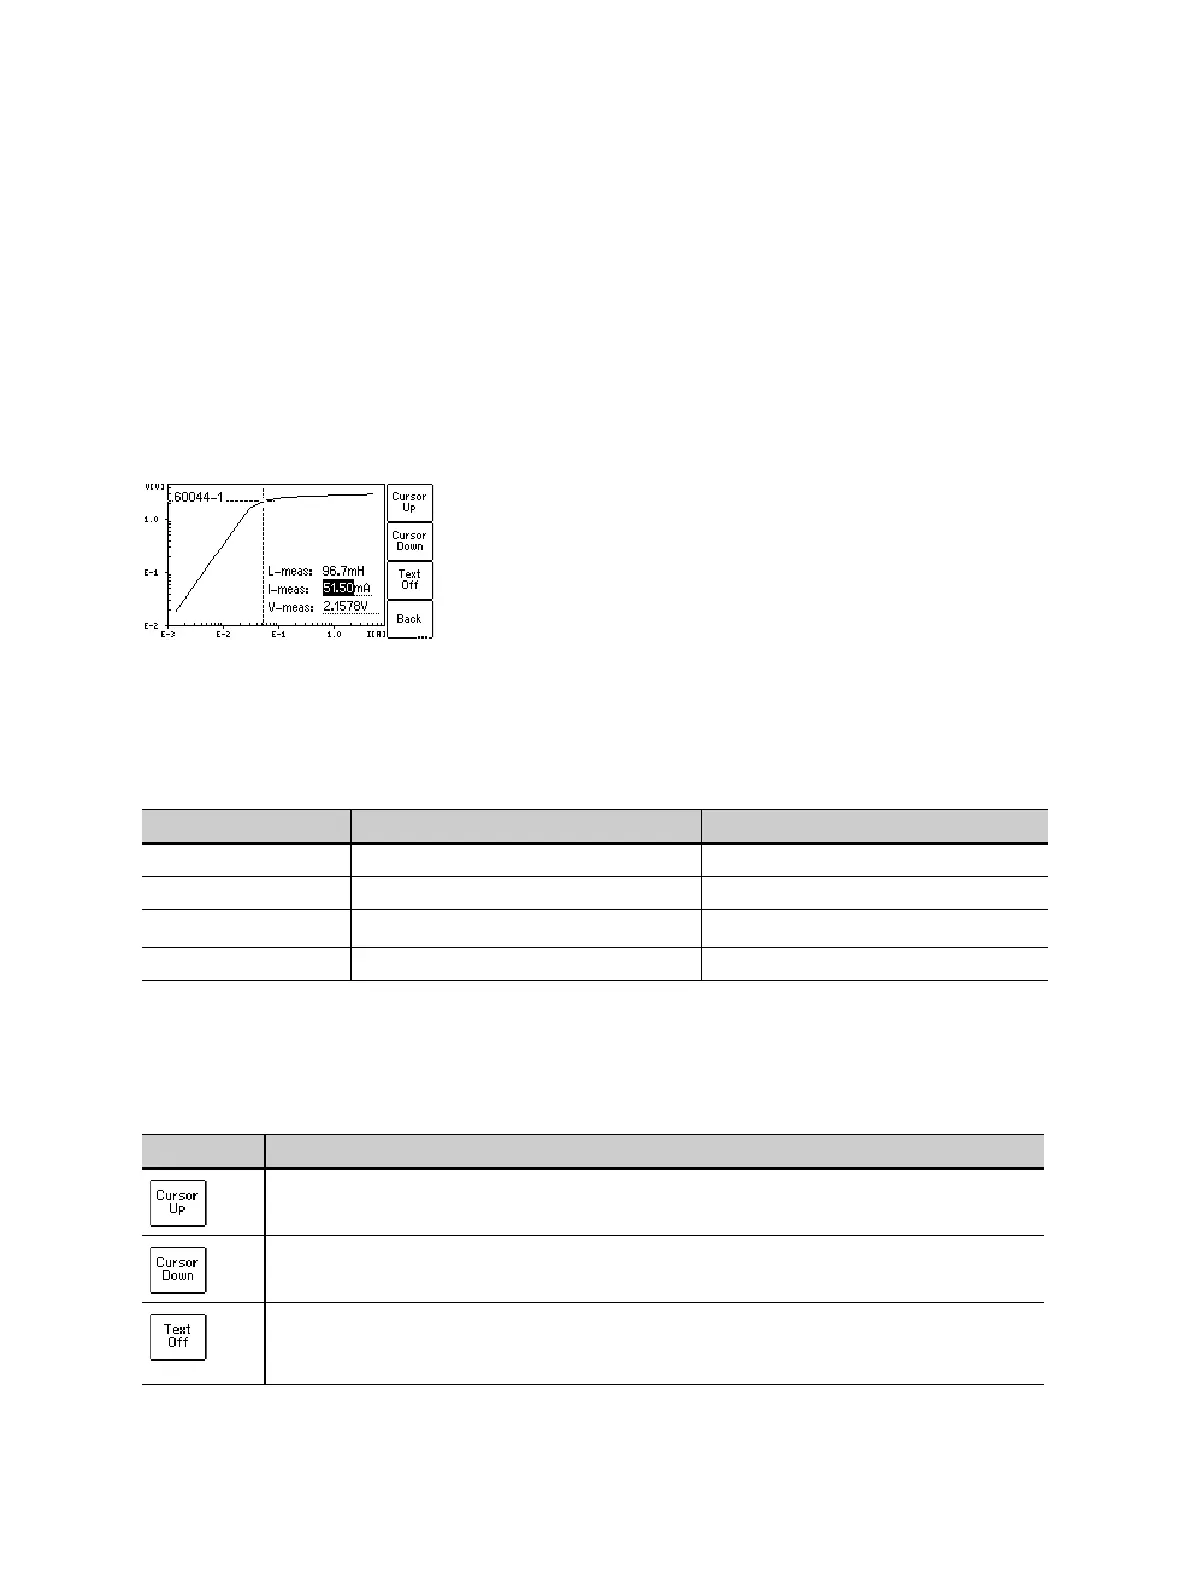
8.6.4 Excitation graph
The excitation graph page shows the graph calculated from the test results. To display the excitation
graph, press the Excit. Graph soft key in the Excitation card. The graph shows the r.m.s. terminal/core
voltage over the r.m.s./peak current depending on the selected standard.
On the bottom right of the diagram the voltage, current and inductance values for the selected point in
the graph are displayed. The currently selected point in the graph is marked by a horizontal and a vertical
dashed line.
In this page it is possible to load the excitation graph of an already saved test from the Compact Flash
card in order to compare this graph with the one of the current test.
Figure 8-13: Excitation graph
Definition of axes in the excitation graph for different standards
Available soft keys
Table 8-22: Definition of axes in the excitation graph
Standard Vertical axis Horizontal axis
IEC 60044-1 r.m.s. terminal voltage r.m.s. excitation current
IEC 60044-6 r.m.s. e.m.f. voltage peak excitation current
IEC 61869-2
average rectified
1
terminal voltage
1. Calibrated to r.m.s.
r.m.s. excitation current
IEEE C57.13 r.m.s. e.m.f. voltage r.m.s. excitation current
Table 8-23: Soft keys available for the excitation graph
Soft key Description
Moves the cursor upwards on the excitation graph.
Moves the cursor downwards on the excitation graph.
Switches off the display of values on the bottom right of the diagram. If you have
switched off the values, this soft key changes to Text On to switch the values display on
again.