Instrument Functions
R&S
®
NRP2
129User Manual 1173.9157.02 ─ 03
"Reference"
This reference level is used to define the pulse width, pulse start time
and pulse stop time.
"Ref's related
to"
Selects how the threshold parameters are to be interpreted, either volt-
age related or power related. Changing from a power based definition
to a voltage based definition and vice versa affects the analysis,
because different points of the waveform are analyzed.
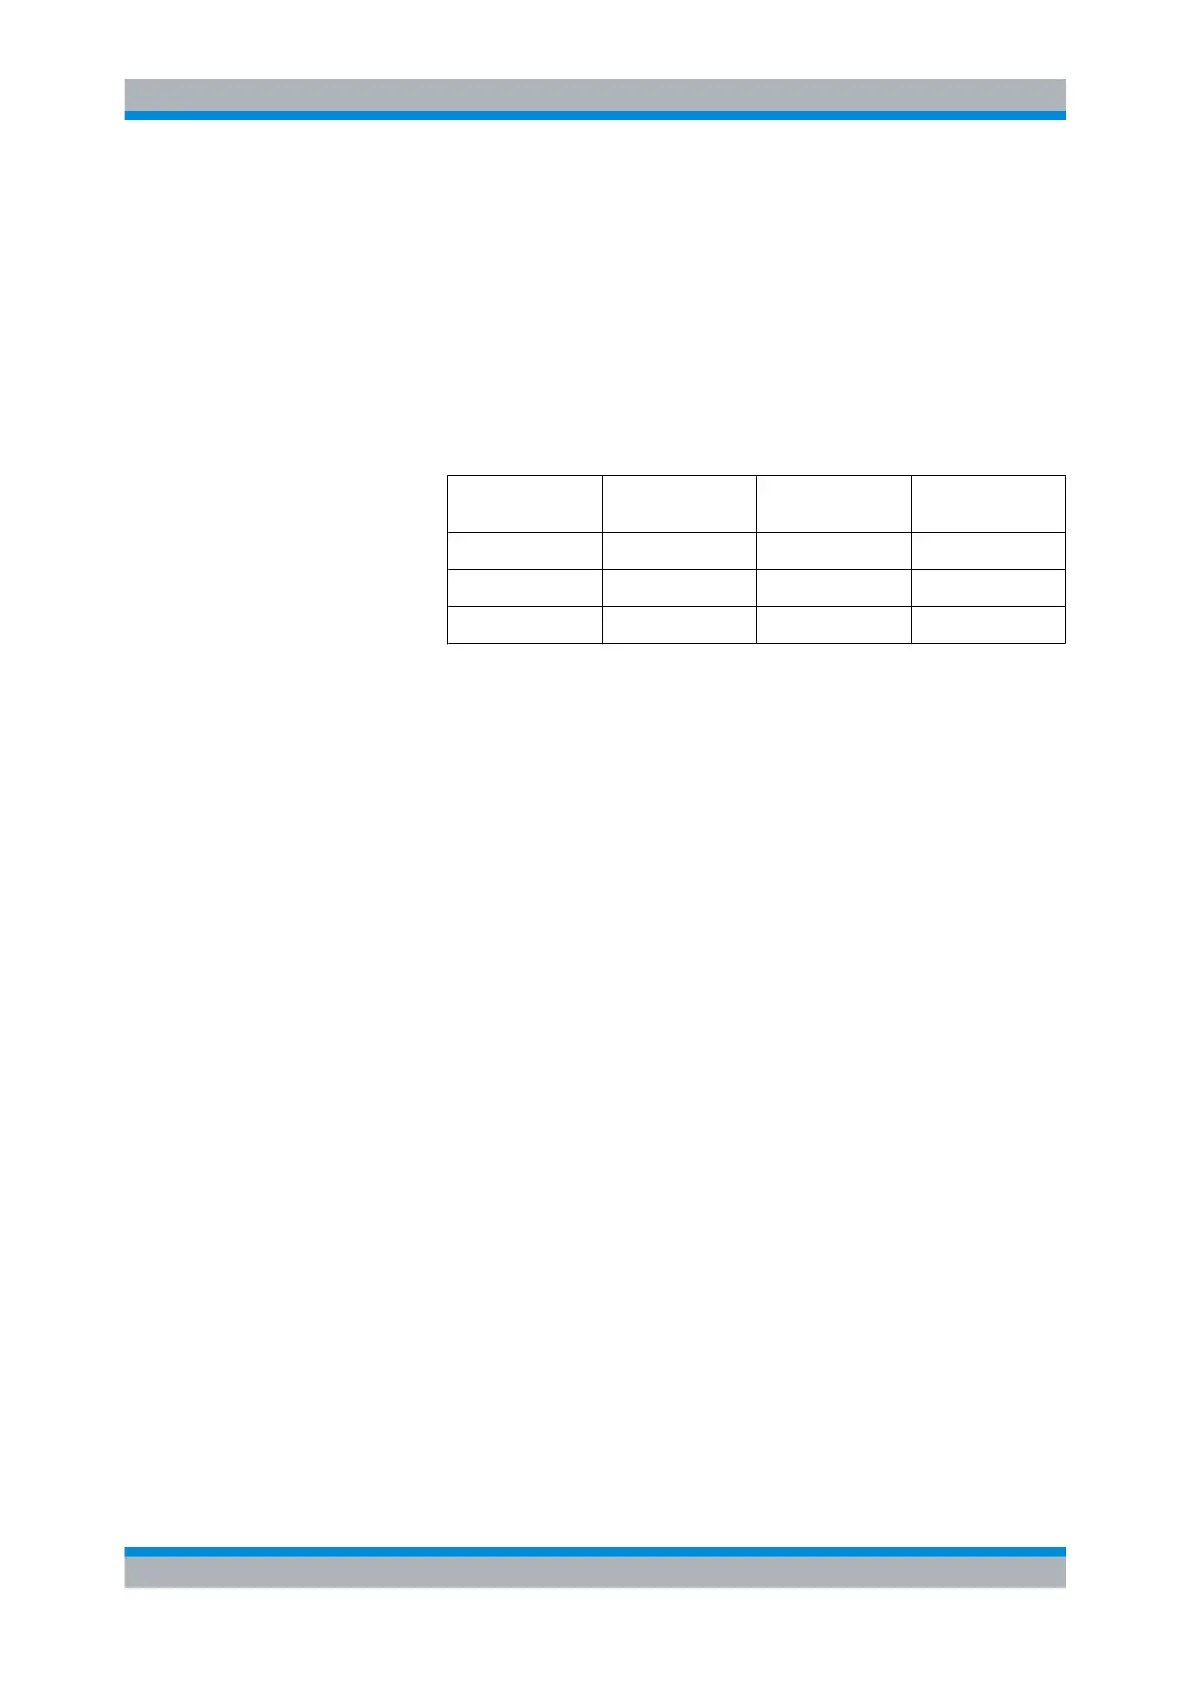
The following table gives the % settings related to power and the dB
figures if the same results are to be obtained as with a typical 10/50/90
definition in terms of voltage. The log values are shown for comparison
only.
Reference Level Voltage related
(%V)
Power related
(%W)
Log. scale (dB)
Low Ref. 10 1 -20
Ref. 50 25 -6
High Ref. 90 81 -0.9
The voltage related definition represents the normal case for analyzing
the pulse parameters.
"Algorithm"
Selects the analysis algorithm for detecting the pulse top and the pulse
base power of a pulsed signal. From these two power levels the refer-
ence levels are derived.
●
"Histogram"
Computes the pulse top/base power by analyzing the histogram of
the trace data. The pulse top level is taken on the mean value of all
points representing the pulse top. Similarly the pulse base is deter-
mined from the points representing the pulse base.
Note: This algorithm is recommended for analyzing most of the
pulse signals
●
"Integration"
Computes the pulse top power by fitting a rectangle pulse of same
energy into the pulse signal as a reference.
Note: This algorithm is recommended for pulse signals with mod-
ulation or when the pulse energy must be taken into account, e.g.
when comparing the measurement result with that of a thermal
power sensor.
●
"Peak"
Assigns the pulse peak power to the pulse top level.
"Set to
defaults"
Presets all parameters in the "Pulse Measurement / Config tab" (10% /
50% / 90%, power related).
4.5.7 Timeslot display mode
The timeslot structure can be defined and displayed in this mode. You can additionally
select one timeslot and measure the most important power parameters of the displayed
waveform within this timeslot. The settings for "Trig"gering, "Filt"ering, "Function", and
"Unit" are taken from the "Trace" display mode and cannot be changed.
Displaying traces