Instrument Functions
R&S
®
NRP2
130User Manual 1173.9157.02 ─ 03
►
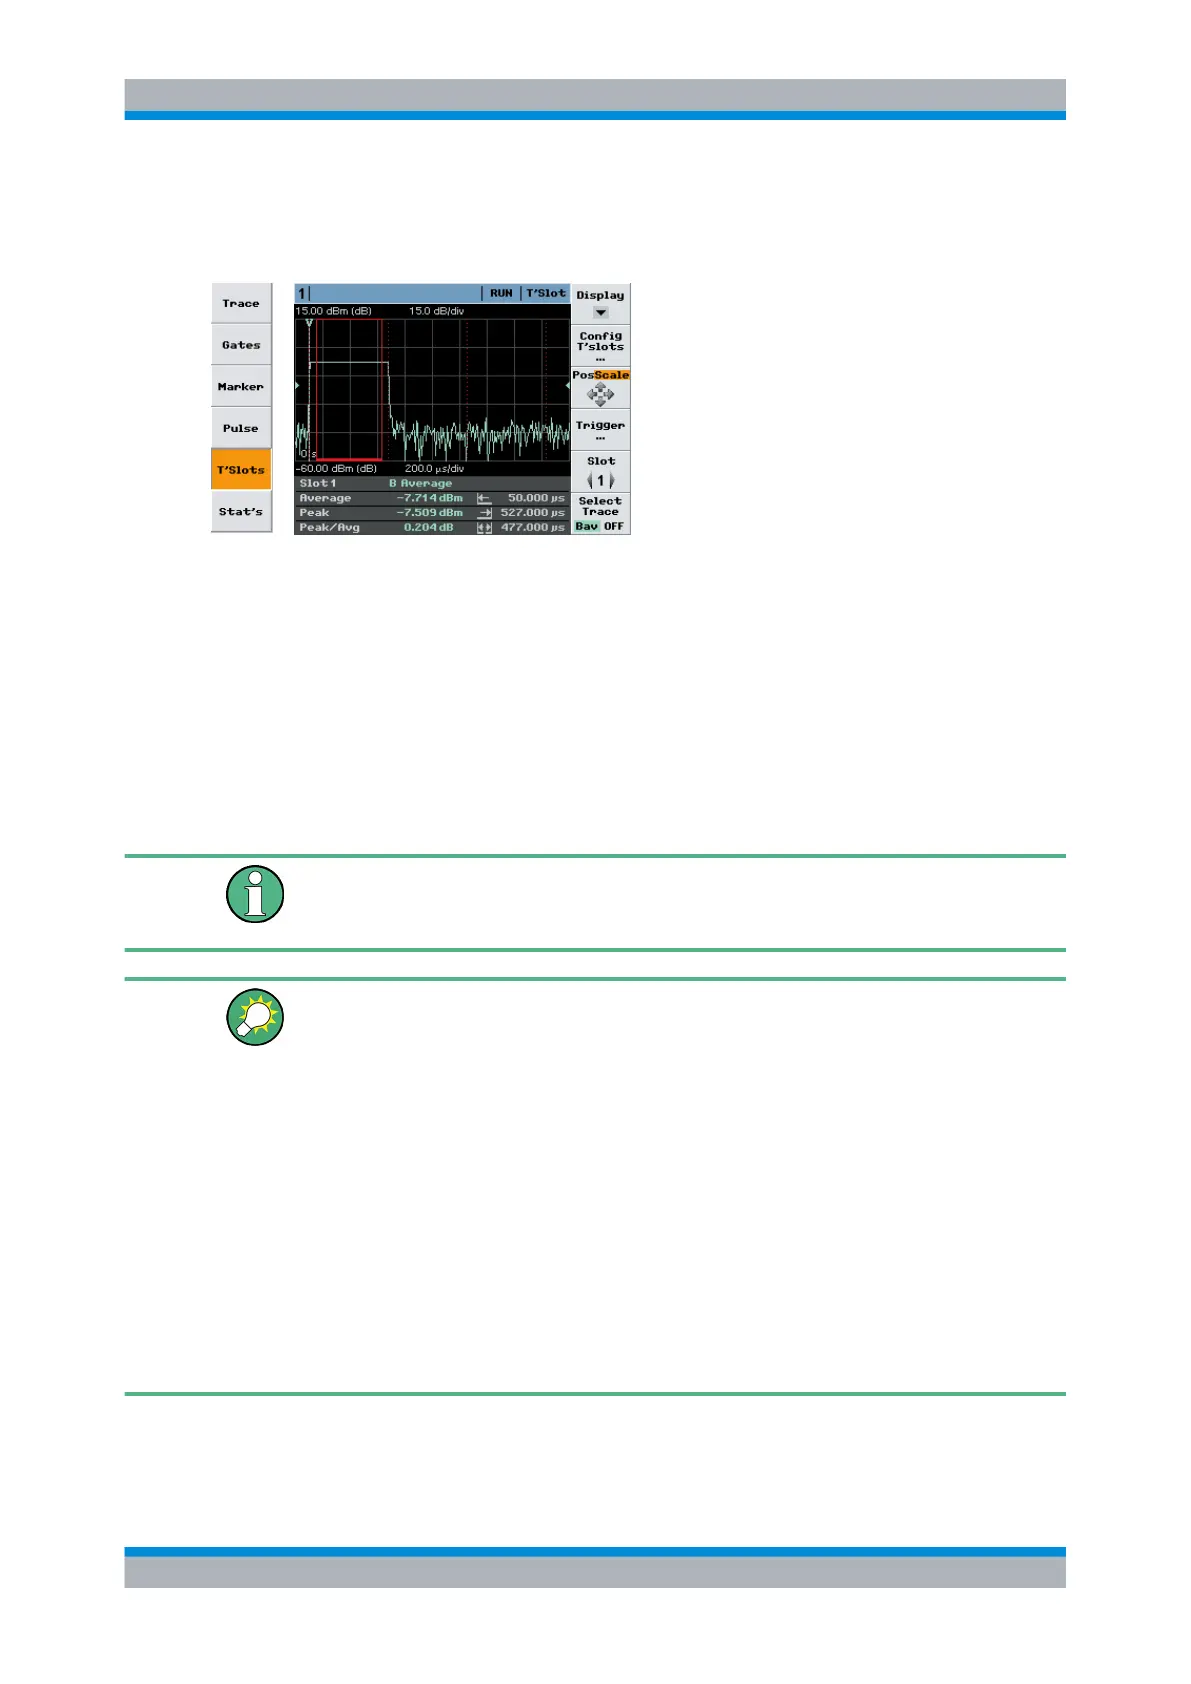
Select "T'Slots" in the control panel opened via the Window→Graph→"Display" dialog
box ("Trace&Statistics" sensor mode).
Fig. 4-59: T'Slot display mode
Slot = channel, measurement function, display type
Average = average power within the selected timeslot
Peak = peak power within the selected timeslot
Peak/Avg = peak power / average power (ratio) within the selected timeslot
I←
= start of measurement
→I
= stopt of measurement
I←→I
= duration of measurement
Time slots are marked by dotted lines. The period of the currently selected time slot over
which the signal is averaged is marked by a colored frame with a continuous lines. If
exclude times have been set this period is shorter than the nominal time slot width.
The defined time slot structure is common for all diplayed waveforms. Individual time slot
structures for specific channels (sensors) can only be configured in numeric "T'slotAV"
mode.
Tips for power measurement in timeslots
● Load mobile radio standard (chapter 4.6.4, "Loading settings for mobile radio stand-
ards", on page 141) or enter the parameters of the timeslot structure in the "Config
T'Slots" menu.
●
Set screen so that the envelope of a complete frame is displayed.
●
Open "Trigger" dialog box and set "Delay" so that the timeslot structure coincides
with the measured envelope.
●
To increase the measurement accuracy,
– expand the window horizontally to such an extent that the selected timeslot is
displayed in adequate size
– perform measurement in the numeric "Timeslot Av" mode.
This mode operates with precisely the time resolution available from the sensor
(sample period). In the graphic mode the time resolution is determined by the
width of a point (pixel).
SCPI commands:
Displaying traces