Instrument Functions
R&S
®
NRP2
134User Manual 1173.9157.02 ─ 03
►
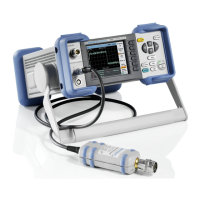
Select "Stat's" in the control panel opened via the Window→Graph→"Display" dialog
box ("Trace&Statistics" sensor mode).
Fig. 4-61: Statistics display mode with one trace
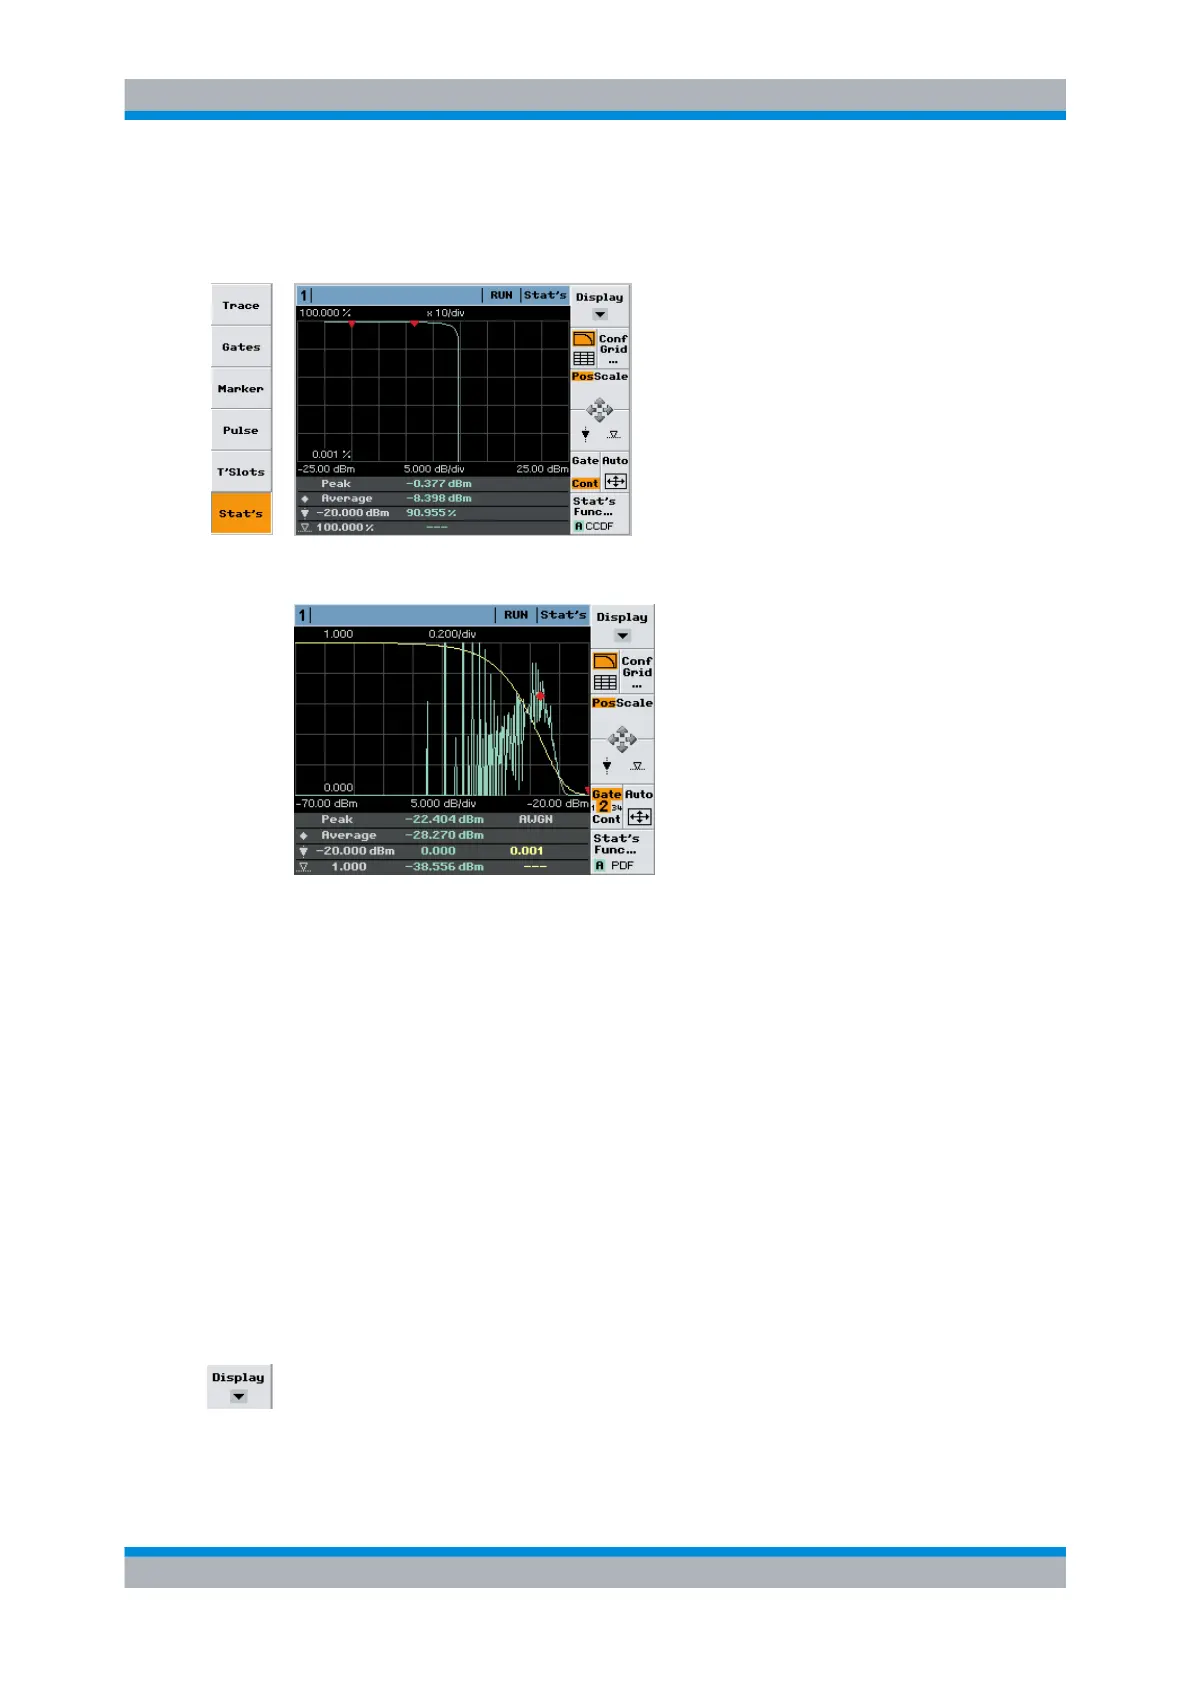
Fig. 4-62: Statistics display mode with two traces (AWGN)
From the gathered samples, four parameters for each trace are indicated in the info panel:
●
the peak power
●
the average power
●
the measurement result at the position of the power (x) marker
●
the power value related to the result (y) marker
In case of AWGN only the measurement result at the position of the power (x) marker is
indicated.
Only in the case of a non-synchronized aquisition interval ("Cont" mode), the indicated
average power value relates to the complete signal. Otherwise, the average power within
the selected gate is indicated.
4.5.8.1 Controls in statistics display mode
Display
Selects another view, see chapter 4.5.2, "Trace window", on page 113.
Displaying traces