MODULAR SAFETY INTEGRATED CONTROLLER MOSAIC
8540780 • 10/07/2020 • Rev.38 229
How to use graphic simulation
Click on the icon to start the graphic simulation.
Graphic simulation can be used to display the signal pattern over time in a graph. First you
must define the stimuli in a specific text file: this means defining the trend over time in the
waveforms used as inputs (stimuli). Based on the stimuli file created, the simulator injects
these into the diagram and displays the traces required in order to perform the simulation.
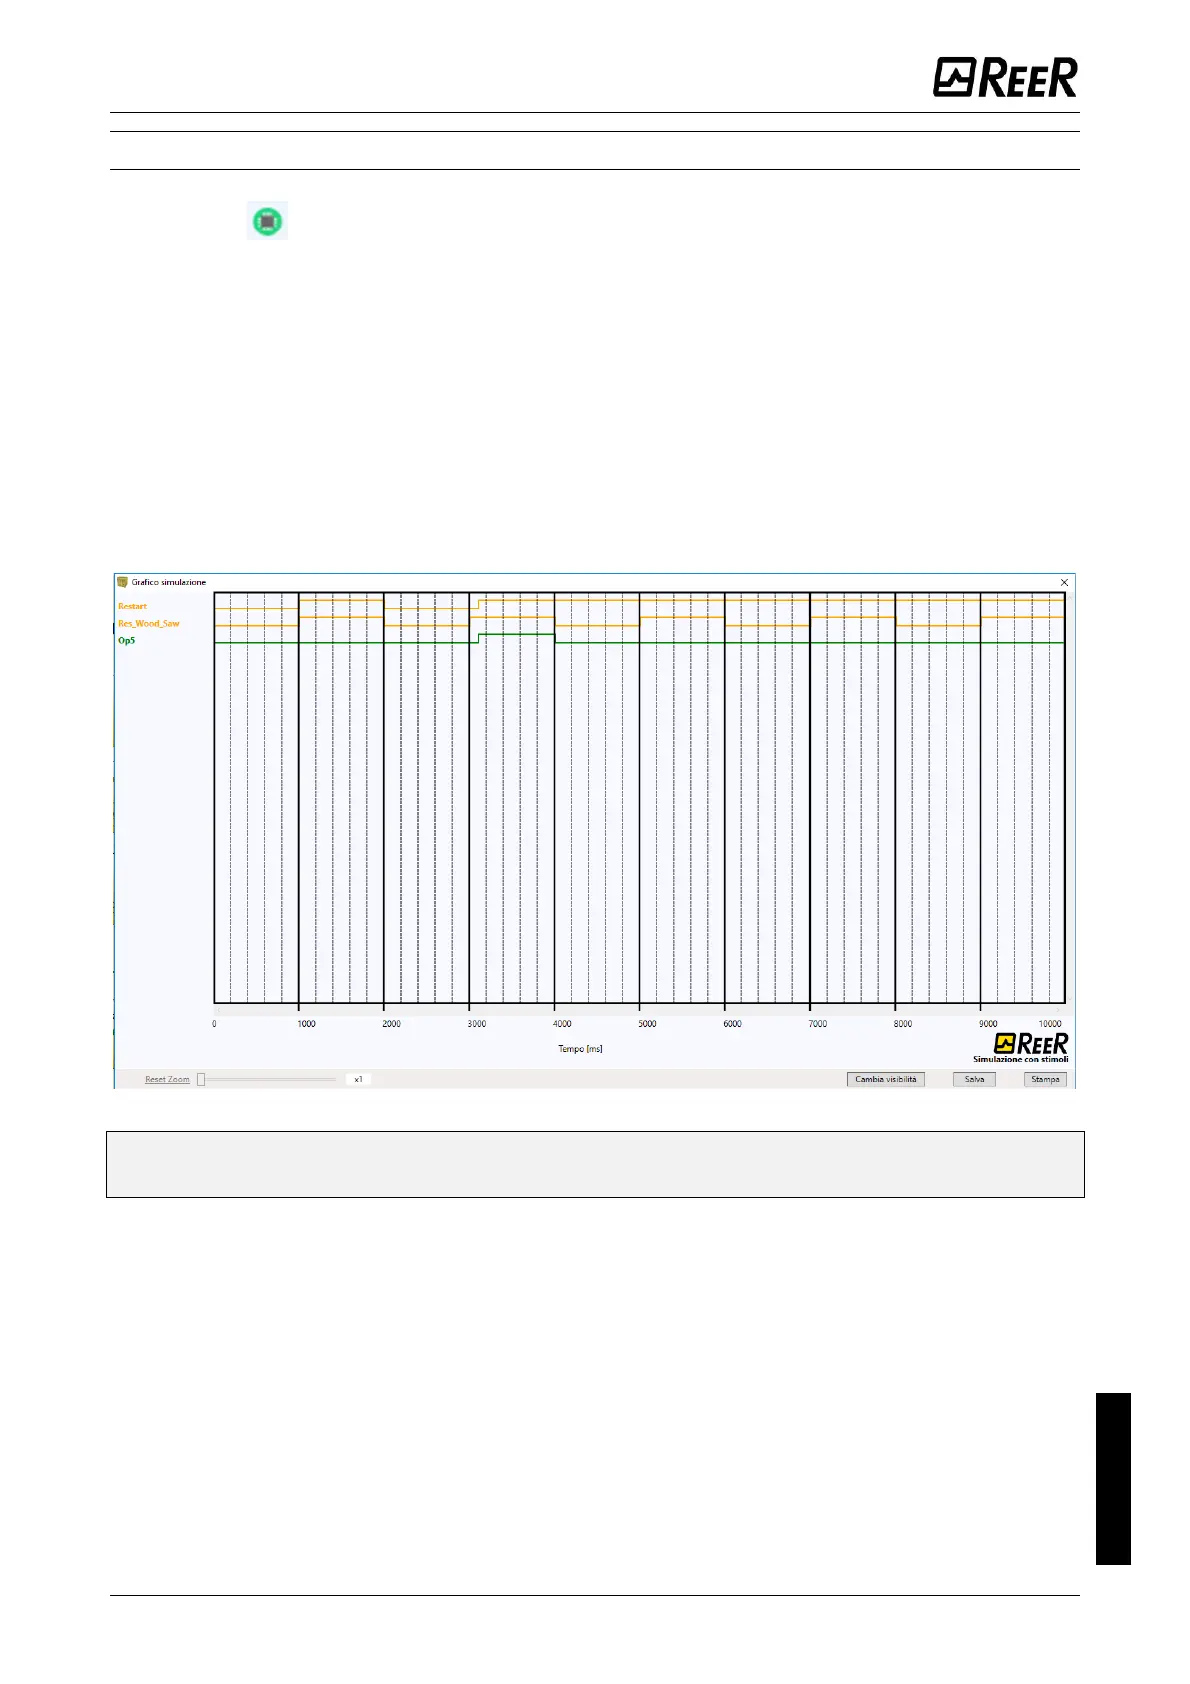
When the simulation is complete, a graph like the one shown below is automatically
displayed. From the graph you can print the traces displayed ("Print"), save the results in
order to load them again later (Save) or display other traces ("Change visibility"). The names
of the traces match the description of the function blocks.
Click the "X" key (top right) to exit the graphic simulation environment.
Figure 94 – Example of a result of the graphic simulation.
It shows the traces and the three keys in the bottom right corner for selecting the
traces, saving and printing.
The simulation can only be carried out after performing at least the following steps.
1. Create a stimuli file to suit your needs.
2. Upload the stimuli file and wait until the simulation finishes.

 Loading...