EasyManua.ls Logo

Renesas H8 Series User Manual

Renesas H8 Series
272 pages
To Next Page IconTo Next Page
To Previous Page IconTo Previous Page
Page #92 background imageLoading...
Page #92 background image
70
[Required number of event occurrences]:
Allows a 16-bit pass count to be set. The event must occur the specified number of
times before the action is taken. The range of values is D’0 to D’65,535.
[Enable Sequencing]: Allows the event to take part in a sequence of events (setting this requires the event to
use an event detector).
[Configure Sequence…]: Displays the [Event Sequencing] dialog box to allow the event sequencing to be
configured (only available when [Enable Sequencing] has been selected).
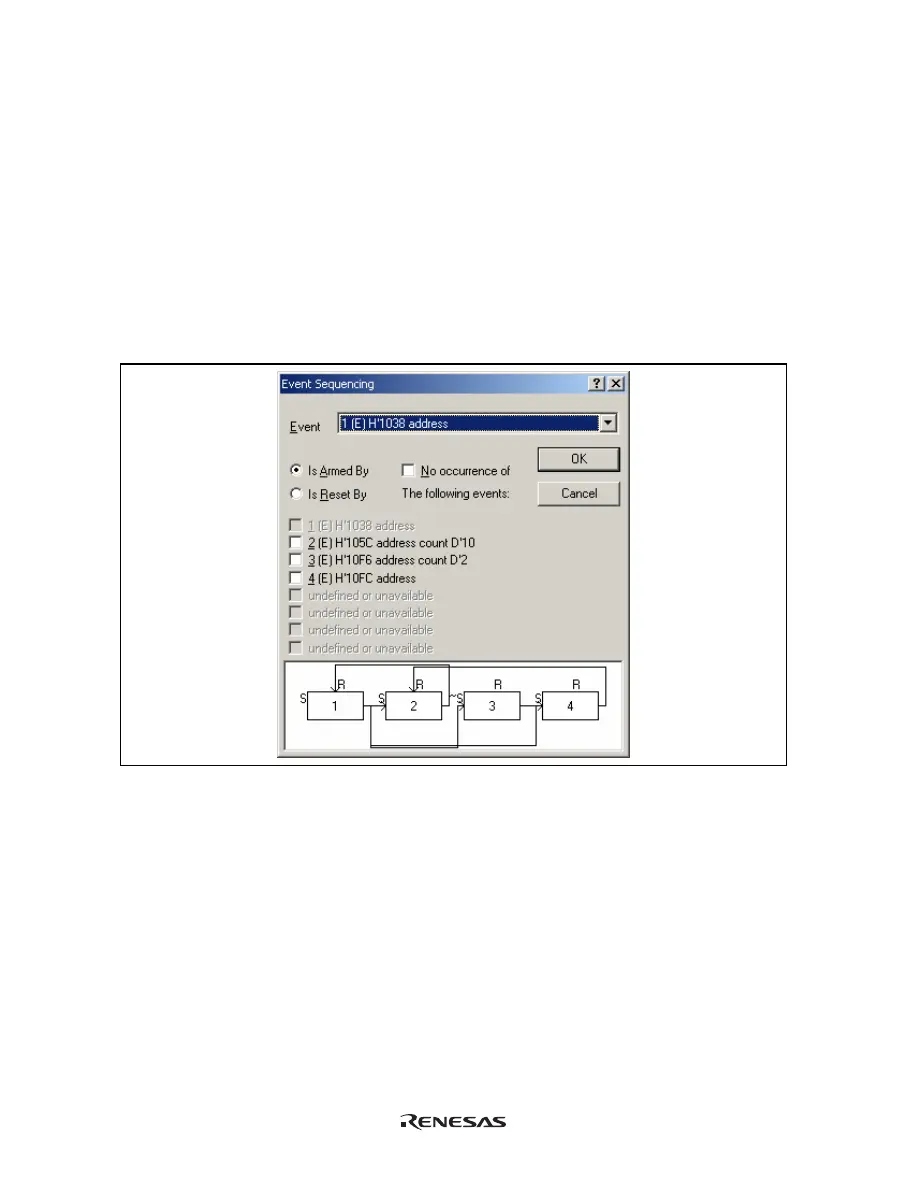
(5) [Event Sequencing] dialog box
This dialog box allows the user to define which events are triggered by other events. If this dialog box is
accessed (directly or indirectly) from [Trace Acquisition…], only those events assigned to the trace subsystem
are displayed. If accessed from the [Eventpoint] window, only the breakpoint or timer events are shown.
Figure 5.26 [Event Sequencing] Dialog Box
[Event]: Selects an event point to be set.
[Is Armed By]: Arms the selected event.
[Is Reset By]: Resets the selected event.
[No occurrence of]: Arms an event when the set of events being selected does not occur (only available
when [Is Armed By] has been selected).
The test of conditions on event points is started with the execution of the user program. The conditions on event
points have not been satisfied immediately after the execution of the user program is started.
Satisfaction of the condition on an event point allows a transition of the state to that where the condition is
satisfied.

Table of Contents

Other manuals for Renesas H8 Series

Question and Answer IconNeed help?

Do you have a question about the Renesas H8 Series and is the answer not in the manual?

Renesas H8 Series Specifications

General IconGeneral
Clock SpeedUp to 20 MHz
Flash MemoryUp to 512 KB
RAMUp to 32 KB
I/O PortsMultiple
Timers8-bit/16-bit timers
ADC10-bit ADC
InterruptsMultiple interrupt sources
DMA ChannelsAvailable in some models
Communication InterfacesUART, SPI, I2C
Package TypesQFP, LQFP

Summary

IMPORTANT INFORMATION

SAFETY PAGE

DEFINITION OF SIGNAL WORDS

Explains the meaning of signal words like DANGER, WARNING, and CAUTION.

Section 1 Overview

Section 2 Preparation before Use

2.1 Emulator Preparation

Guides the user through unpacking and initial setup of the emulator.

2.2 Installing Emulator’s Software

Directs users to install the necessary High-performance Embedded Workshop software.

2.3 Connecting to the User System

Explains how to physically connect the emulator to the user's system.

2.4 Power Supply

Details the requirements and handling of the emulator's power supply.

2.6 Hardware Interface

Explains the physical connections and interface circuits of the emulator.

Section 3 E6000 Emulator Functions

3.1 Debugging Features

Lists various debugging capabilities like breakpoints, trace, and timing measurements.

3.2 Complex Event System (CES)

Explains the system for defining complex conditions for trace, break, and timing.

3.3 Hardware Features

Details the emulator's hardware aspects like memory, clocks, and probes.

Section 4 Preparation before Use

4.1 Method for Activating High-performance Embedded Workshop

Guides users on starting the High-performance Embedded Workshop application.

4.2 Connecting the Emulator

Explains the procedures for establishing a connection with the emulator.

Section 5 Debugging

5.1 Setting the Environment for Emulation

Guides users on configuring the emulator environment for target MCUs.

5.2 Downloading a Program

Explains how to load programs for debugging and view source code.

5.5 Displaying Memory Contents in Realtime

Explains how to monitor memory contents during program execution.

5.6 Viewing the Variables

Guides users on observing variable values in the source program.

5.7 Using the Event Points

Covers setting breakpoints and event points for advanced debugging.

5.8 Viewing the Trace Information

Explains how to capture and analyze execution traces.

5.9 Analyzing Performance

Describes how to measure program execution time and performance.

Section 6 Tutorial

6.3 Downloading the Tutorial Program

Explains the process of loading the tutorial program for debugging.

6.4 Setting a Software Breakpoint

Demonstrates how to set a software breakpoint in the editor.

6.5 Setting Registers

Shows how to modify register values, specifically the program counter.

6.6 Executing the Program

Guides on running the program and observing its execution.

6.9 Viewing Memory

Demonstrates how to view memory contents using label names.

6.10 Watching Variables

Shows how to monitor variable values during program execution.

6.12 Stepping Through a Program

Covers step-by-step execution commands like Step In, Step Over, Step Out.

6.15 Break Function

Describes the emulator's break functions, including software breaks.

Section 7 Hardware Specifications Specific to This Product

Section 8 Software Specifications Specific to This Product

Related product manuals