172
(3) Click the [OK] button to open the [Monitor] window.
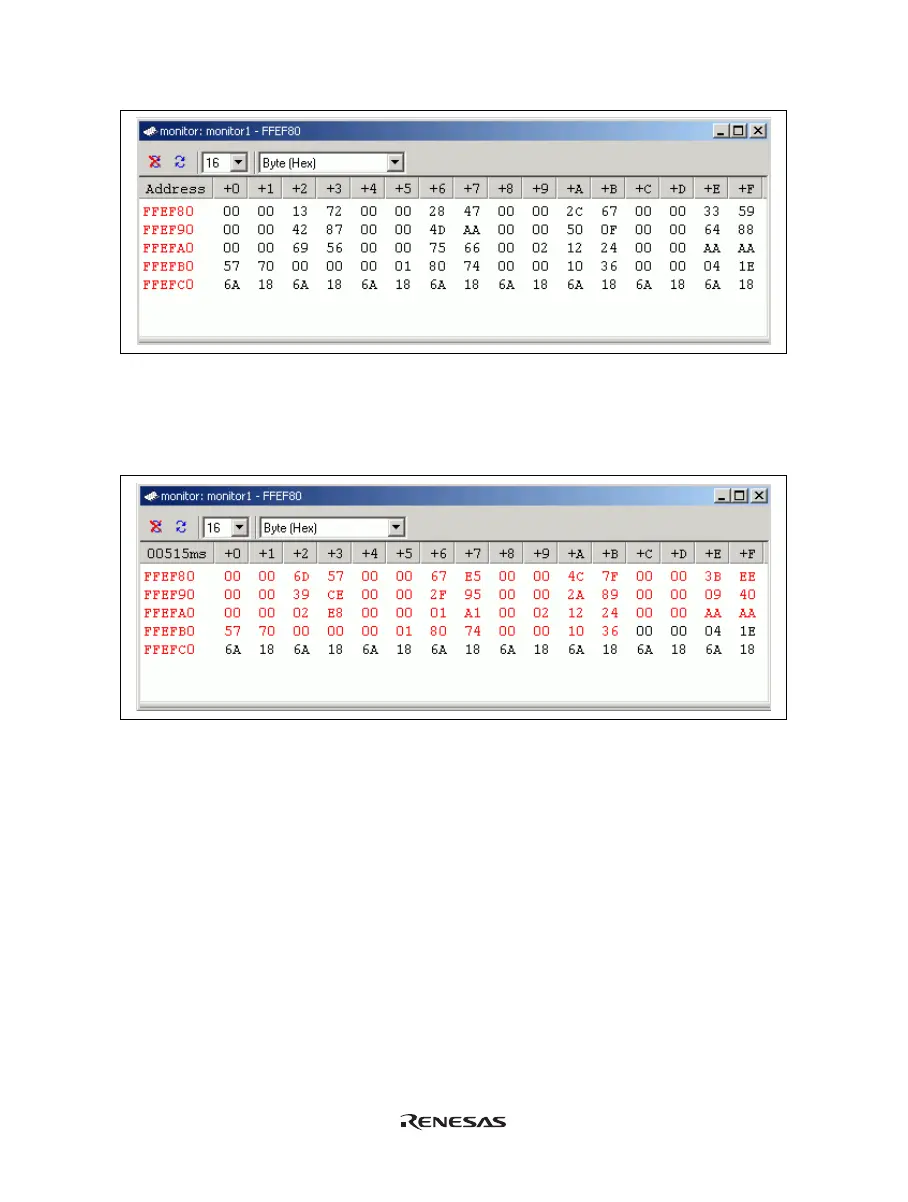
Figure 6.71 [Monitor] Window
(4) Select [Reset Go] from the [Debug] menu. When the content of the address range changes with execution,
the updated values are red (i.e. the color that was selected in the [Foreground] and [Background] combo
boxes). Values will be displayed in black if they have not been updated or a certain period of time has
elapsed since the last update.
Figure 6.72 [Monitor] Window (during Execution)
(5) After you have finished checking the states in the [Monitor] window, select [Halt Program] from the [Debug]
menu to halt the program’s execution.
6.20 What Next?
This tutorial has described the major features of the emulator and the use of the High-performance Embedded
Workshop.
Sophisticated debugging can be carried out by using the emulation functions that the emulator offers. This
provides for effective investigation of hardware and software problems by accurately isolating and identifying
the conditions under which such problems arise.
 Loading...