EasyManua.ls Logo

Renesas H8 Series User Manual

Renesas H8 Series
272 pages
To Next Page IconTo Next Page
To Previous Page IconTo Previous Page
Page #96 background imageLoading...
Page #96 background image
74
5.8 Viewing the Trace Information
The emulator acquires the results of each instruction execution into the trace buffer as trace information and
displays it in the [Trace] window. The conditions for the trace information acquisition can be specified in the
[Trace Acquisition] dialog box.
Since trace information in bus-cycles is acquired by the hardware circuit and stored in the trace buffer, the
realtime operation is retained. The [Trace] window displays the content of the trace buffer, which records up to
32,768 bus cycles from the last program run and is always updated.
5.8.1 Opening the [Trace] Window
To open the [Trace] window, choose [View -> Code -> Trace] or click the [Trace] toolbar button (
).
5.8.2 Acquiring Trace Information
When the emulator does not set the acquisition condition of the trace information, all bus cycles are acquired by
default without any condition (free trace mode).
In the free trace mode, trace acquisition is started with the execution of the user program and stopped by halting
the user program. The acquired trace information is displayed in the [Trace] window.
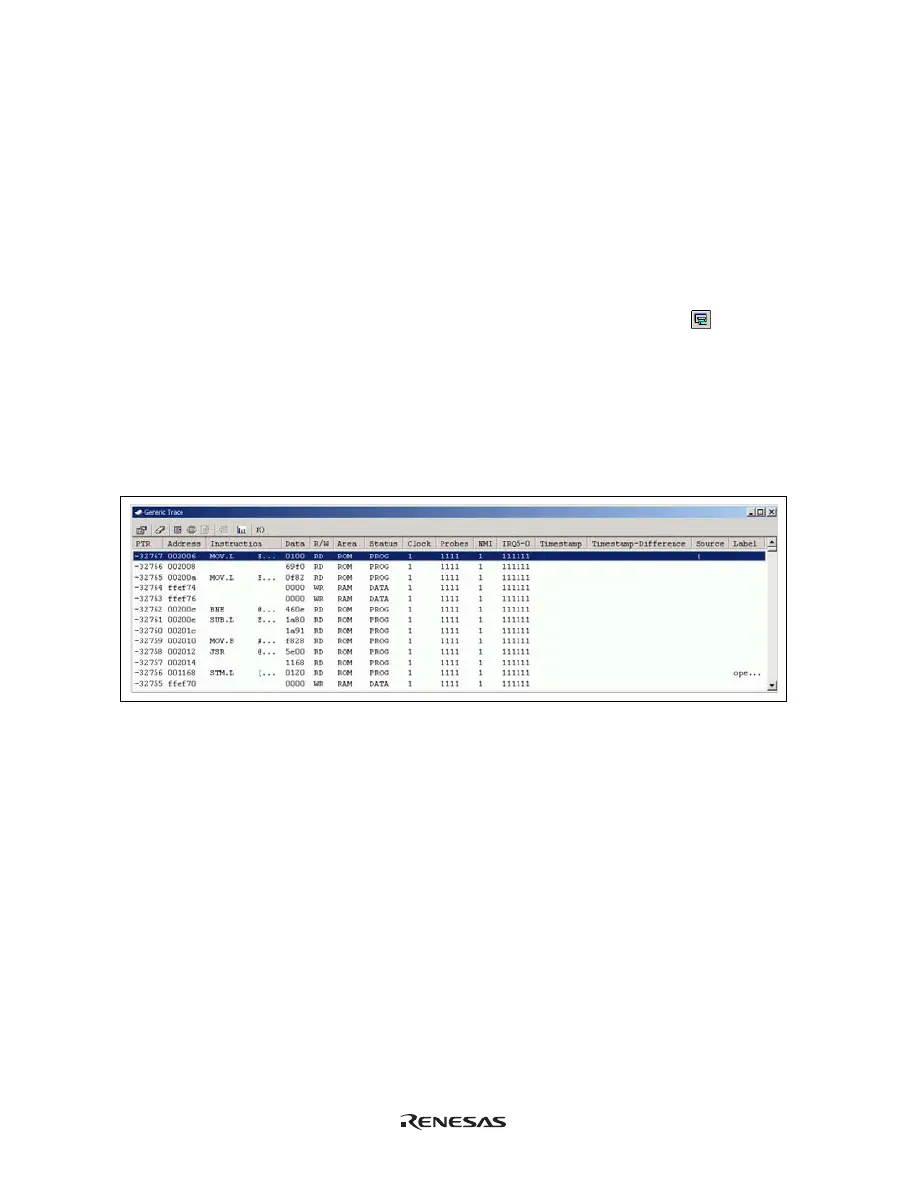
Figure 5.29 [Trace] Window
This window displays the following trace information items:
[PTR]: Cycle number in the trace buffer. When the most recent record is record 0, earlier
record numbers go backwards (-1, -2, ...). If a delay count has been set, the cycle
number where the trace stop condition has been satisfied is record 0. For the cycle
(during delay) executed until the trace has stopped, earlier record numbers go forward
(+1, +2, ...) the most recent record.
[Address]: Address (6-digit hexadecimal)
[Instruction]: Disassembled code of the executed instruction
[Data]: Data bus value, displayed as 2-digit or 4-digit hexadecimal
[R/W]: Whether access was read (RD) or write (WR)
[Area]: Memory area being accessed; ROM, RAM, 8- or 16-bit I/O, 8- or 16-bit EXT
(external), or DTC RAM (not available when a time stamp is acquired)

Table of Contents

Other manuals for Renesas H8 Series

Question and Answer IconNeed help?

Do you have a question about the Renesas H8 Series and is the answer not in the manual?

Renesas H8 Series Specifications

General IconGeneral
Clock SpeedUp to 20 MHz
Flash MemoryUp to 512 KB
RAMUp to 32 KB
I/O PortsMultiple
Timers8-bit/16-bit timers
ADC10-bit ADC
InterruptsMultiple interrupt sources
DMA ChannelsAvailable in some models
Communication InterfacesUART, SPI, I2C
Package TypesQFP, LQFP

Summary

IMPORTANT INFORMATION

SAFETY PAGE

DEFINITION OF SIGNAL WORDS

Explains the meaning of signal words like DANGER, WARNING, and CAUTION.

Section 1 Overview

Section 2 Preparation before Use

2.1 Emulator Preparation

Guides the user through unpacking and initial setup of the emulator.

2.2 Installing Emulator’s Software

Directs users to install the necessary High-performance Embedded Workshop software.

2.3 Connecting to the User System

Explains how to physically connect the emulator to the user's system.

2.4 Power Supply

Details the requirements and handling of the emulator's power supply.

2.6 Hardware Interface

Explains the physical connections and interface circuits of the emulator.

Section 3 E6000 Emulator Functions

3.1 Debugging Features

Lists various debugging capabilities like breakpoints, trace, and timing measurements.

3.2 Complex Event System (CES)

Explains the system for defining complex conditions for trace, break, and timing.

3.3 Hardware Features

Details the emulator's hardware aspects like memory, clocks, and probes.

Section 4 Preparation before Use

4.1 Method for Activating High-performance Embedded Workshop

Guides users on starting the High-performance Embedded Workshop application.

4.2 Connecting the Emulator

Explains the procedures for establishing a connection with the emulator.

Section 5 Debugging

5.1 Setting the Environment for Emulation

Guides users on configuring the emulator environment for target MCUs.

5.2 Downloading a Program

Explains how to load programs for debugging and view source code.

5.5 Displaying Memory Contents in Realtime

Explains how to monitor memory contents during program execution.

5.6 Viewing the Variables

Guides users on observing variable values in the source program.

5.7 Using the Event Points

Covers setting breakpoints and event points for advanced debugging.

5.8 Viewing the Trace Information

Explains how to capture and analyze execution traces.

5.9 Analyzing Performance

Describes how to measure program execution time and performance.

Section 6 Tutorial

6.3 Downloading the Tutorial Program

Explains the process of loading the tutorial program for debugging.

6.4 Setting a Software Breakpoint

Demonstrates how to set a software breakpoint in the editor.

6.5 Setting Registers

Shows how to modify register values, specifically the program counter.

6.6 Executing the Program

Guides on running the program and observing its execution.

6.9 Viewing Memory

Demonstrates how to view memory contents using label names.

6.10 Watching Variables

Shows how to monitor variable values during program execution.

6.12 Stepping Through a Program

Covers step-by-step execution commands like Step In, Step Over, Step Out.

6.15 Break Function

Describes the emulator's break functions, including software breaks.

Section 7 Hardware Specifications Specific to This Product

Section 8 Software Specifications Specific to This Product

Related product manuals