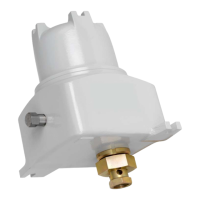
Figure 13 - Engineering Display
The engineer will have to write down or memorise exactly what variables they have
selected for the engineering display to make full use of it. The engineer display options are
configured as if they are items 1-6 in the normal operator display with items 1 to 3 on the top
line and 4 to 6 on the bottom.
2.6.5 BAR GRAPH 1
Selecting this option from the Display Setup menu will result in the register screen
being displayed. Scroll through or jump to a known register number by entering the numerical
value from the front panel and select it using the enter key. Once selected you will be prompted
for a min and a max value. This is the range over which the chosen value will be scaled so that
it can be represented as a percentage using the ten available bar graph LEDs.
A simple example is to select a min of 0 and a max of 100 (I.e., Imagine we are using
the bar graphs to represent batch percent). Each LED of the bar graph represents 10%. E.g.,
10% of the batch has passed or the can is 10% full.
The bar graph LEDs are also able to show gradual changes and can indicate when the
scale (100%) has been exceeded. For example, using the example of batch percent, when the
batch is between 0-10% the first LED will be solid. When it is between 10-20% the first 2 LED’s
will remain solid.
The LEDs are also able to indicate when a given value exceeds 100%, as may be the
case in the InSpec Sampler when batch percent is exceeded but flow is still present. When the
value is higher than 100% but less than 110%, all LED segments will be lit solid except the first
led which will be off. If the value is between 110 – 120 % then all segments will be lit solid
except the second LED which will be off. Again, this is a repeated pattern. If the value was
between 190 – 200% then all segments will be lit solid but the 10th LED will be off. Above
200%, all ten LED segments flash on/off repeatedly. At this point, the bar graphs have
exceeded their resolution and no meaningful value can be displayed other than to say it is
above 200%. This is very unlikely to happen except during an error condition.
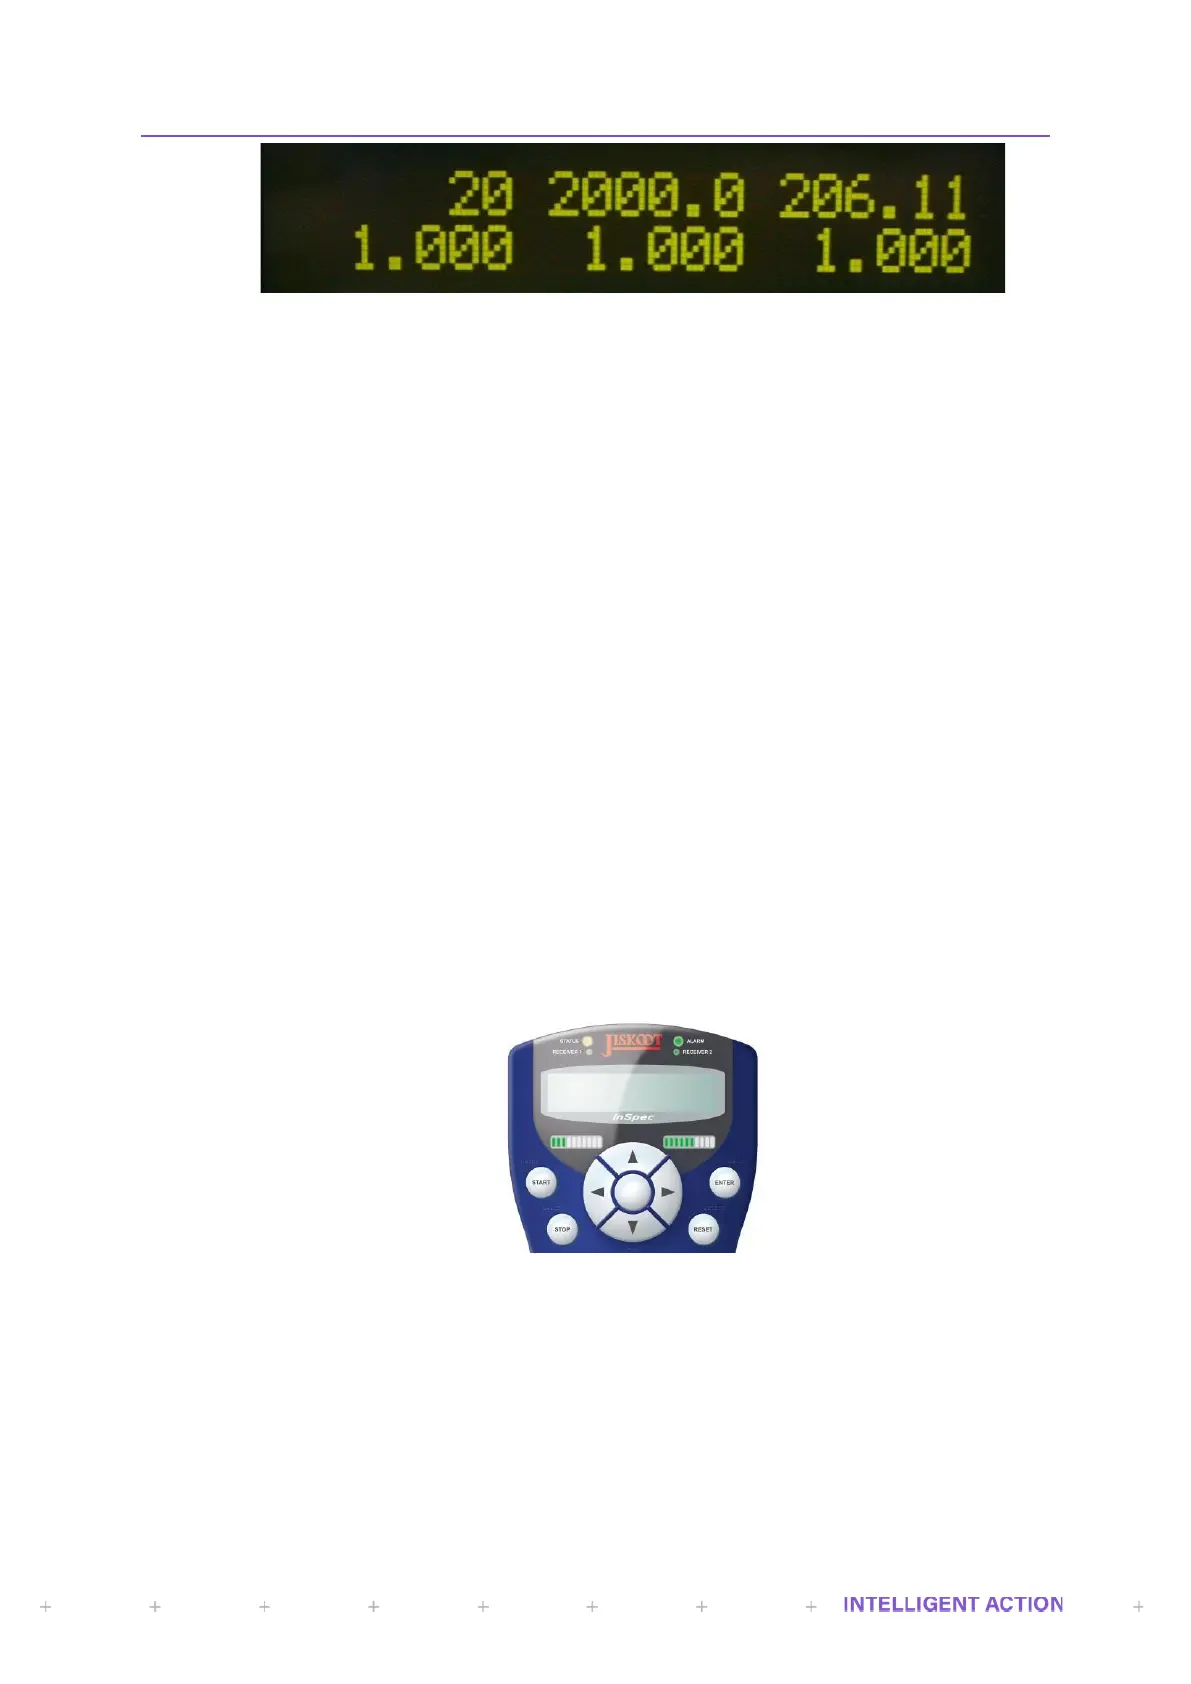
Figure 14 - Bar Graphs 1 & 2
In the above picture Bar Graph 1 indicates 30% and Bar Graph 2 60%
2.6.6 BAR GRAPH 2
As above
 Loading...