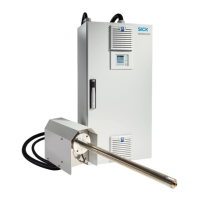
Figure 61: Menu Measuring Screens - Bar
graph
Example: Measuring screen 1 with bar
graph layout I (6 bars)
1 b
Enter desired names (tags). MAR‐
SIC300 tags: see "Tags (variable
names)", page 100
Scaling the measured value box: see
"Measuring screen", page 44
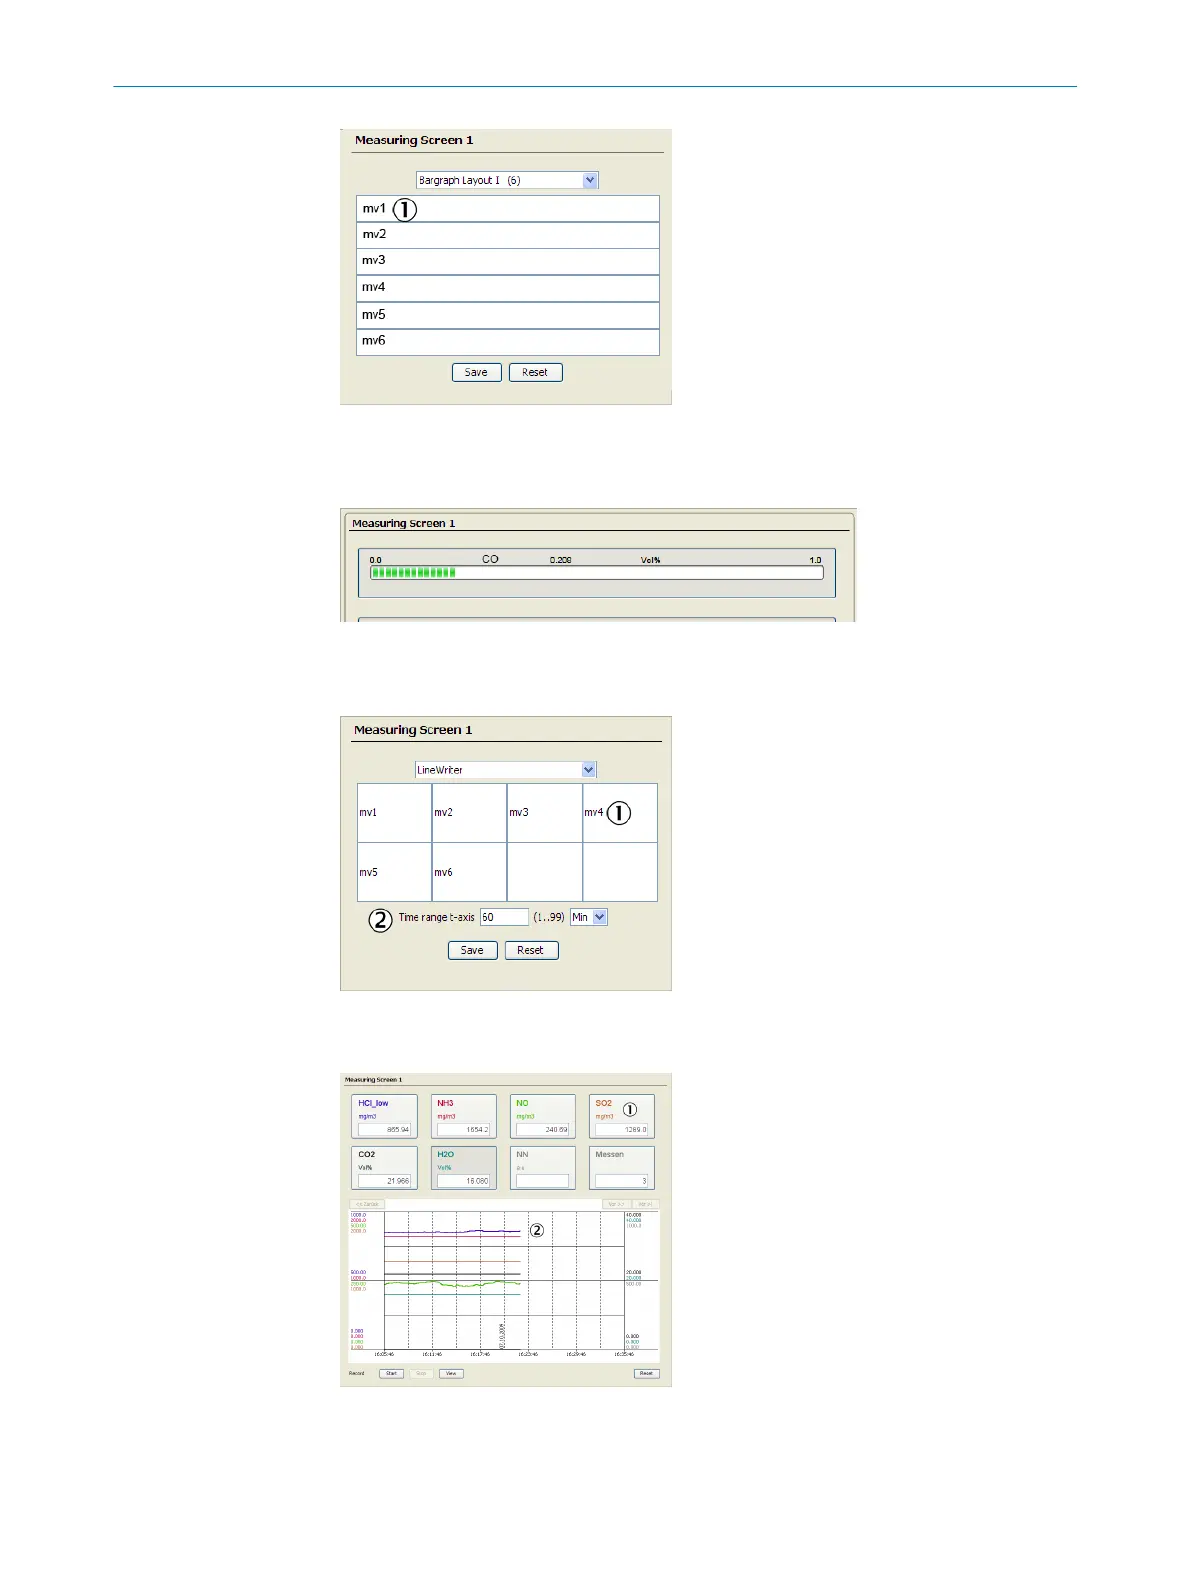
The Measuring screen then looks like this:
Figure 62: Bar graph - example
Line Writer
Figure 63: Menu Measuring Screens - Tags
1
b
Enter desired names (tags).
Scaling the measured value box: see
"Measuring screen", page 44
2
Scaling the time axis [sec, min or hrs],
scaling the y-axis: see "Measuring
screen", page 44
The Measuring screen then looks like this:
Figure 64: Menu Measuring Screens - Line
Writer
1
Measured value box
2
Line Writer
PARAMETERIZATION 6
8017585/YXD9/V3-1/2017-05 | SICK T E C H N I C A L I N F O R M A T I O N | MARSIC300
49
Subject to change without notice
 Loading...