8.7.2 Elements and functionality of the diagram user interface
The user interface displays the signal flows with a legend on the right-hand side. Individual
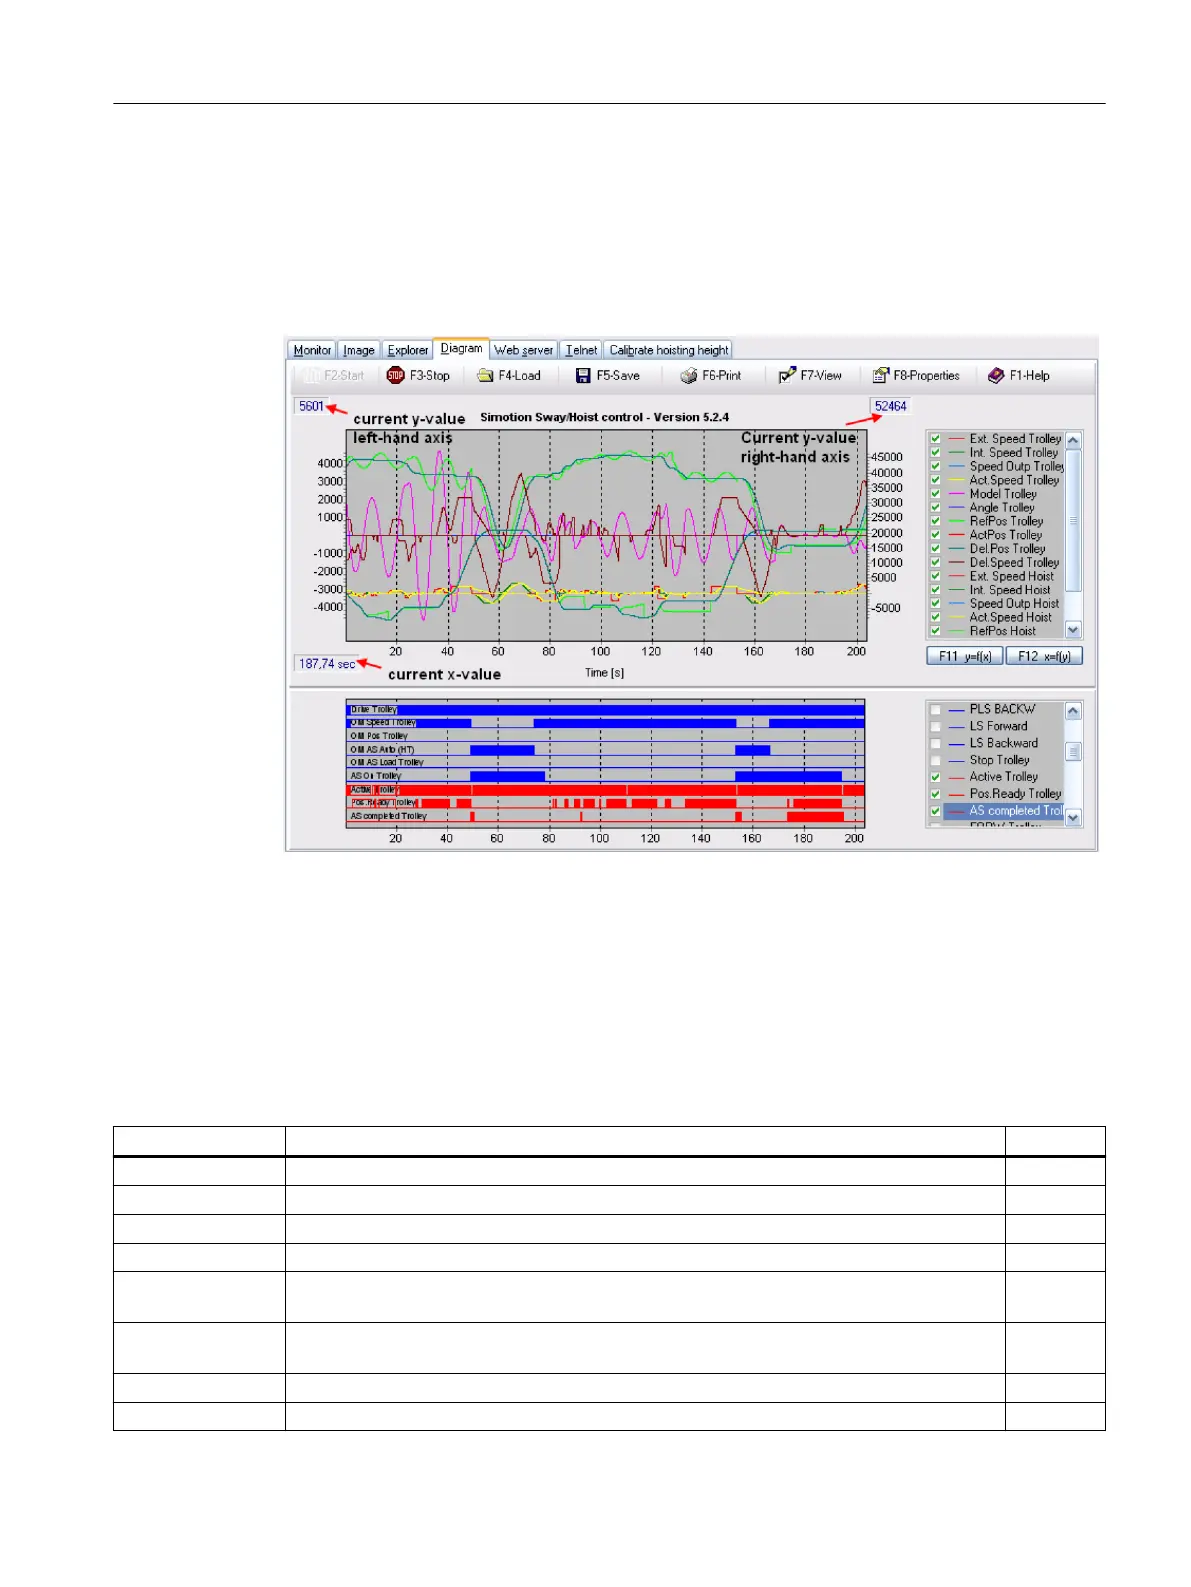
values or all values can be selected in this legend. If you move the mouse pointer over the
curves, the current x and y values will be displayed dynamically in the corners, as shown in the
following figure.
Figure 8-27 Diagram function, display elements
Because of the size relationships, the velocity values and the pendulum deflection are located
on the left-hand axis in the distance/velocity-time curve. The curves for the distance are located
on the right-hand axis. The signals are displayed only as numeric values without unit so that the
user can arbitrarily assign the curves to the axes. The default assignment of the signals to the
axes and the associated unit are listed in the following table.
Values to be transferred
Table 8-2 Analog signals, trolley
Short name Meaning Unit
V_SET [TR] Trolley set velocity specified by the master switch mm/s
V_REF [TR] Trolley set velocity using the set ramps mm/s
V_POS [TR] Trolley output velocity computed by the calculation model mm/s
V_ACT [TR] Actual trolley velocity mm/s
DEL_MODEL [TR] Pendulum deflection calculated by the model (distance of the reflector from its home po‐
sition)
mm
DEL_CAMERA
[TR]
Pendulum deflection detected by the camera measuring system (distance of the reflector
from its home position)
mm
S_REF [TR] Set position, trolley mm
S_ACT [TR] Actual position, trolley mm
SIMOCRANE CeCOMM commissioning and diagnostic program
8.7 Diagram - trace function
SC integrated STS, GSU
Operating Instructions, 07/2019, A5E48271265B AA 293
 Loading...