14
Operating via a web browser within your own network
2.4 Accessing Yield Data
Access the yield data from the header bar.
The following options can be selected from the left-side navigation menu.
•
Current values
•
Production
•
Consumption (only appears when a consumption meter is connected)
•
Balances
•
Finances
•
Sensor (only appears when a sensor is connected)
•
System Information
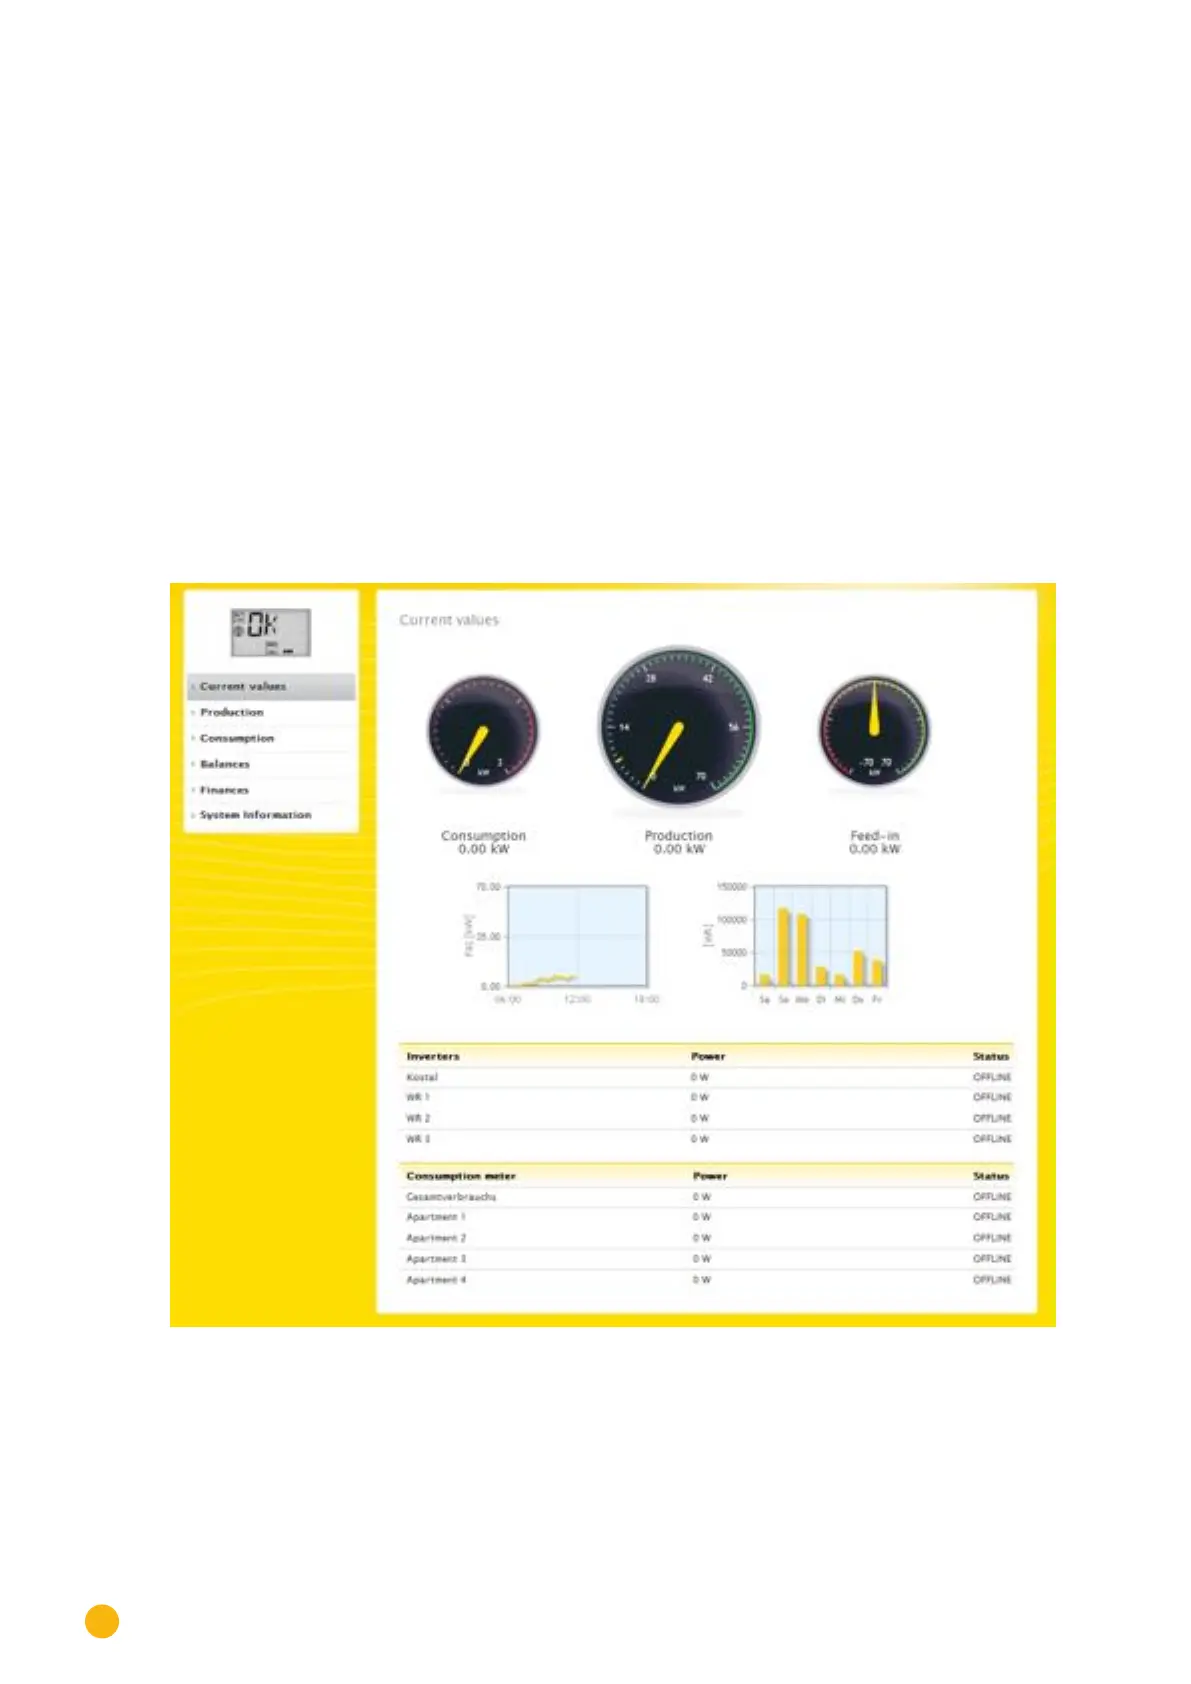
2.4.1 Current values
Select the Current values menu to see the plant's new Dashboard view.
Fig.: The plant's current values
The following values are displayed in a tachometer format:
•
Consumption (only when consumption meters are connected). Displays the current consumption.
•
Production (Output generated by the plant). Displays the current production.
•
Feed-in amount (only when meters are connected). Displays the power output that is currently be-
ing fed into the grid.
There are two graphs below the Dashboard display:
 Loading...


