32
Operating via a web browser within your own network
The calculations are based on the rate defined in the Configuration | Plant | Electricity Costs settings.
•
PV revenue:
This displays all of the revenue from the PV plant based on the feed-in and self-consumption tariffs and the
electricity costs saved with self-consumption.
•
Purchased power expenses:
This displays the total expenses for the power obtained from the grid.
•
Total:
This is the total after the purchased power expenses have been subtracted from the PV revenue.
Note!
The overview curve is only visible in the Yield Data | Finances section after sev-
eral weeks of data recording.
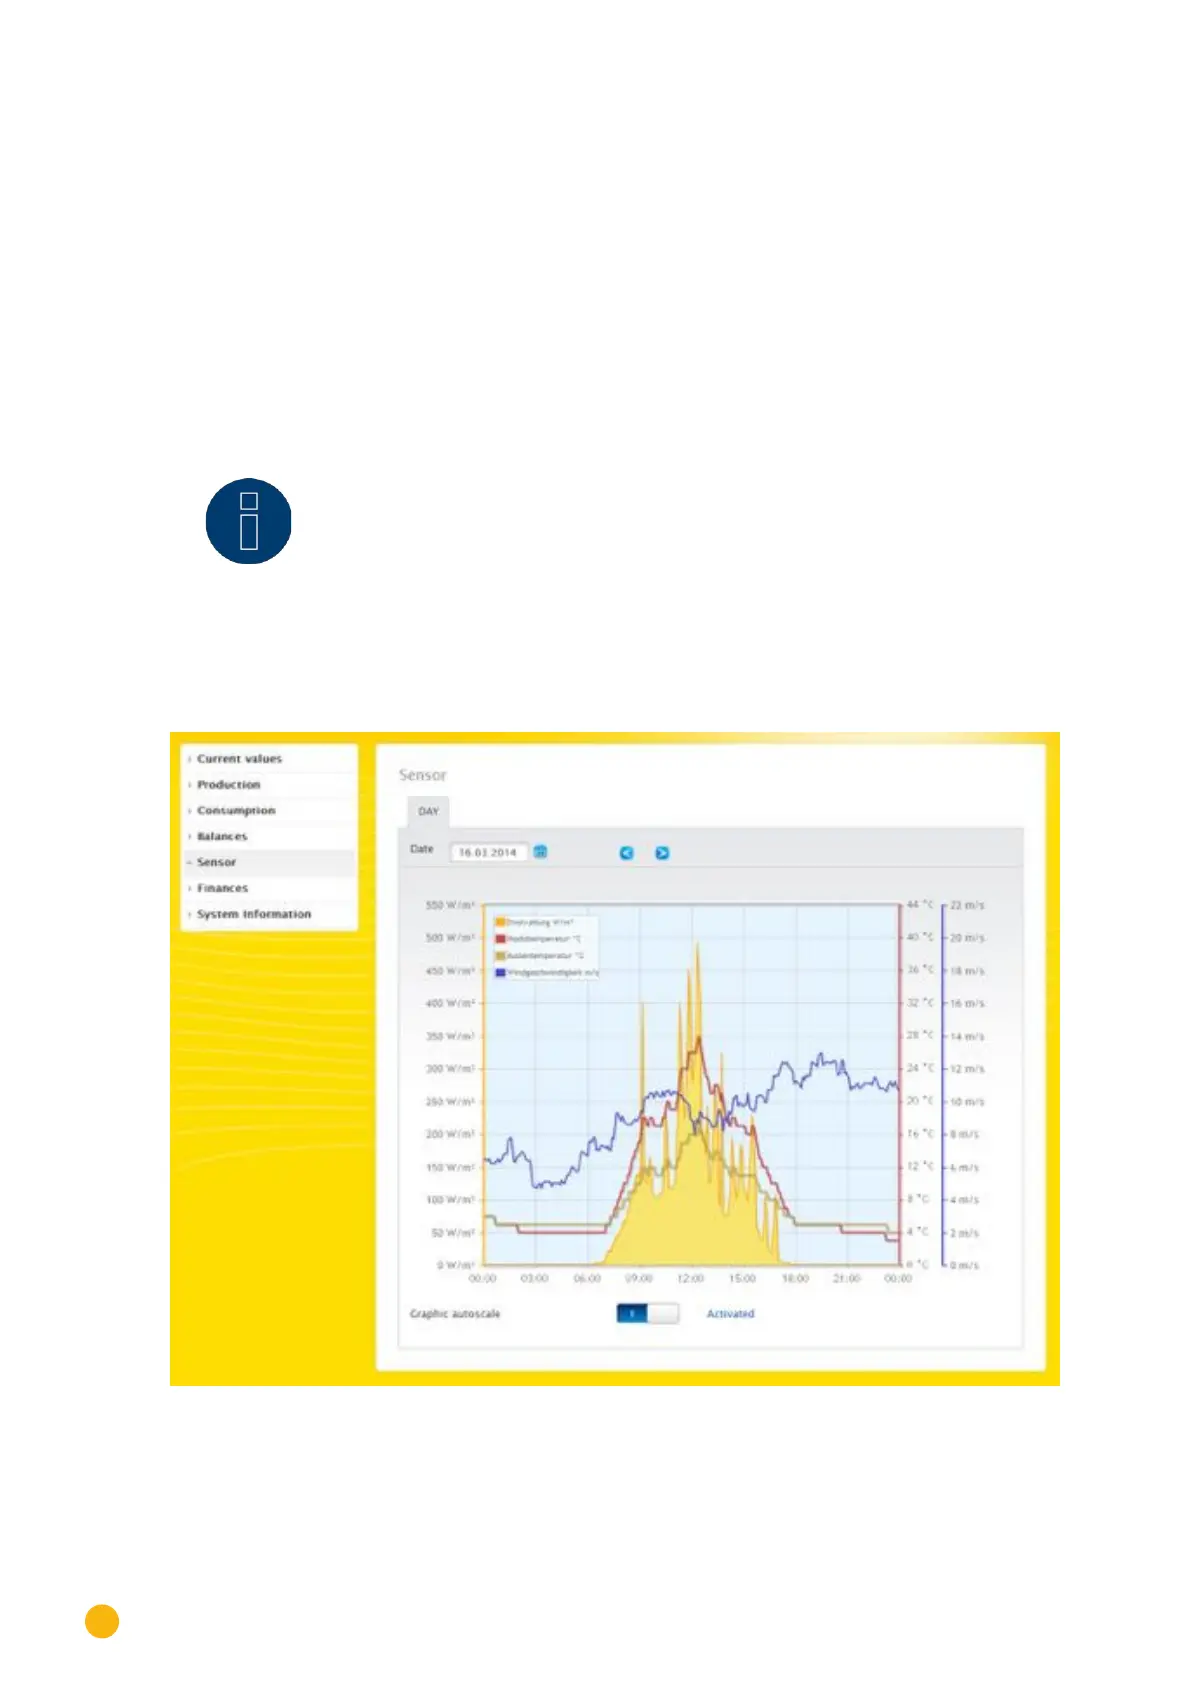
2.8 Sensor
A graphic evaluation from the connected sensors can be displayed from the Senor menu.
Fig.: Graph of Sensor Box values
The following values can be displayed individually:
•
IrradiationW/m²
•
Module temperature C°
•
Ambient temperature C°
•
Wind speed m/s