33
Operating via a web browser within your own network
Different values with different units are displayed in the graph. The units used and their colors are dis-
played in the key at the top.
Here you also have the option to show or hide individual values with a mouse click. You can select and
subsequently evaluate certain days with the Date box.
Note!
Data is only available if a sensor is connected.
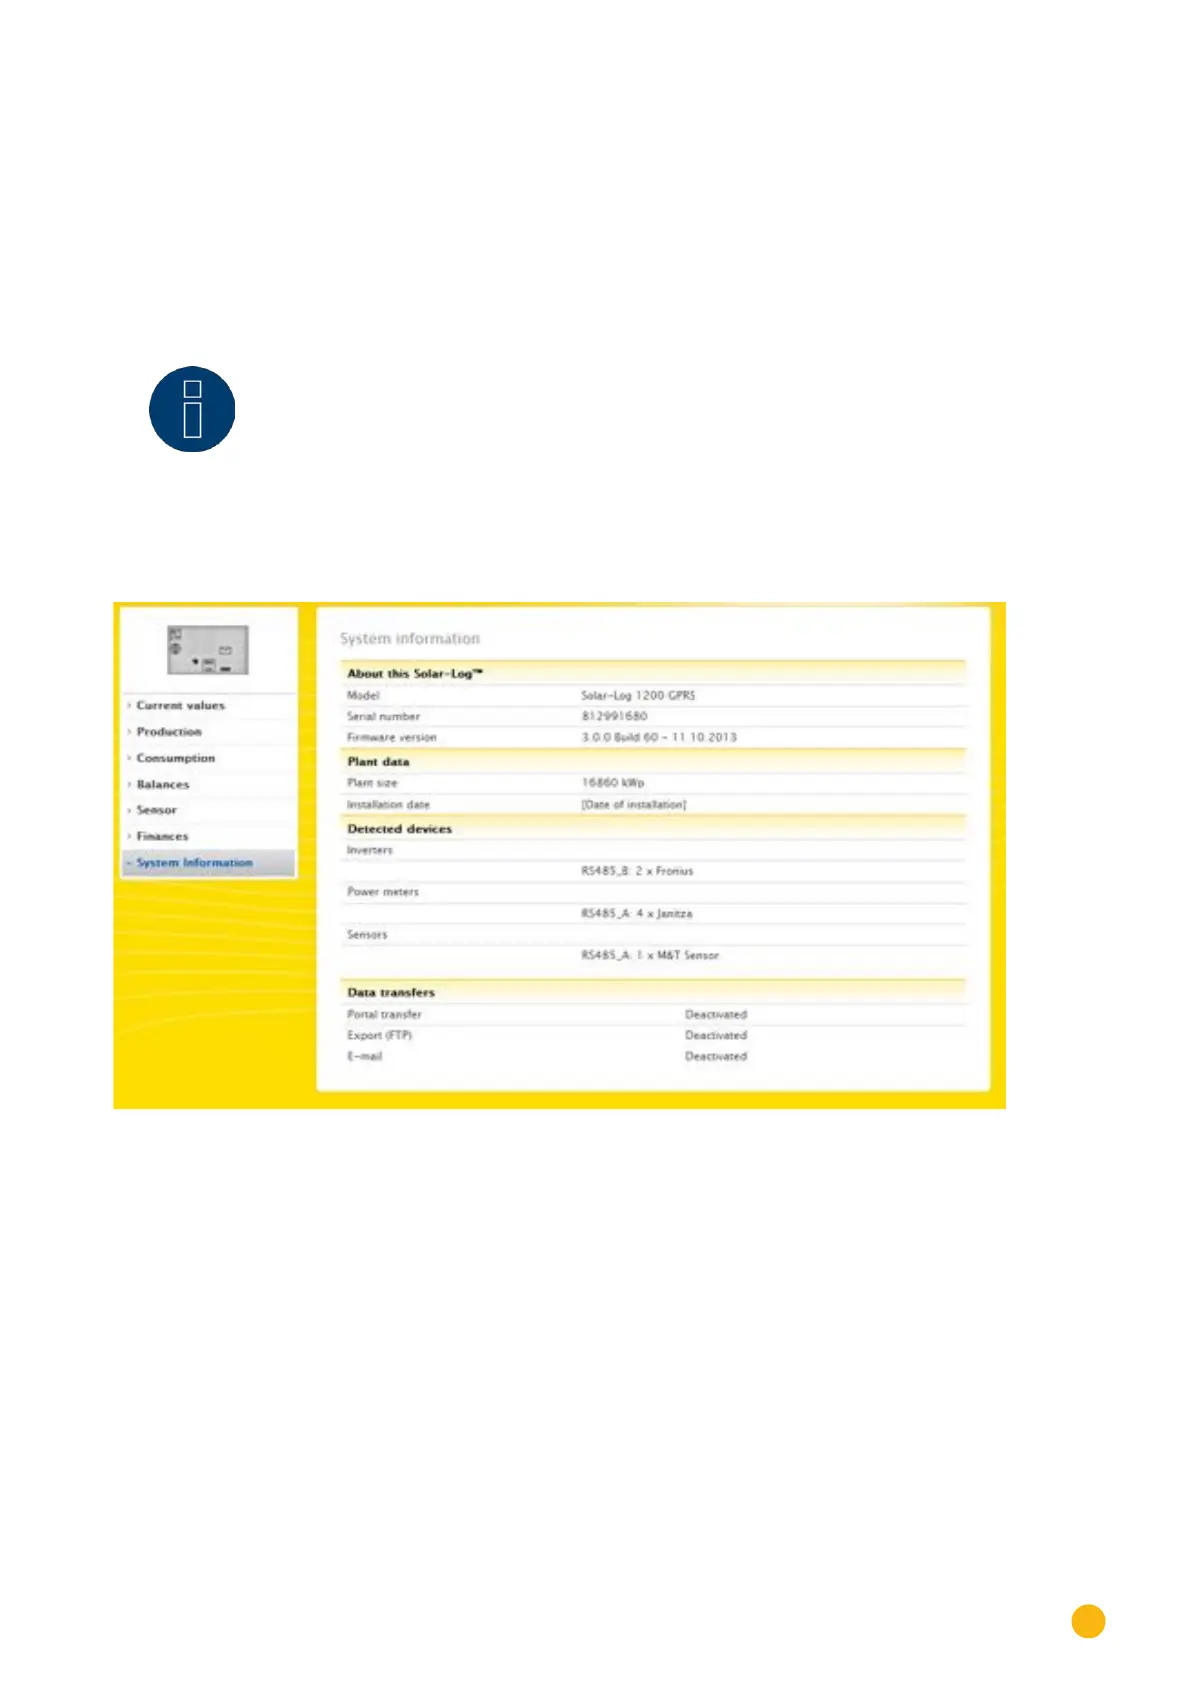
2.9 System Information
Go to the System info menu for plant and system information.
Fig.: System Information
The following information is displayed:
About this Solar-Log™:
•
Model
•
Serial number
•
Firmware version
Plant data:
•
Plant size
•
Installation date
Detected devices:
•
Inverters
•
Power meters
•
Sensors
Data transfers:
•
Portal transfer (activated/deactivated)