31
Operating via a web browser within your own network
2.7 Finances
Your plant's financial performance can be displayed as a graph or table from the Finances menu. (See the
chapter "Defining Tariffs and Costs" in Installation Manual for the configuration of the tariff and consump-
tion values)
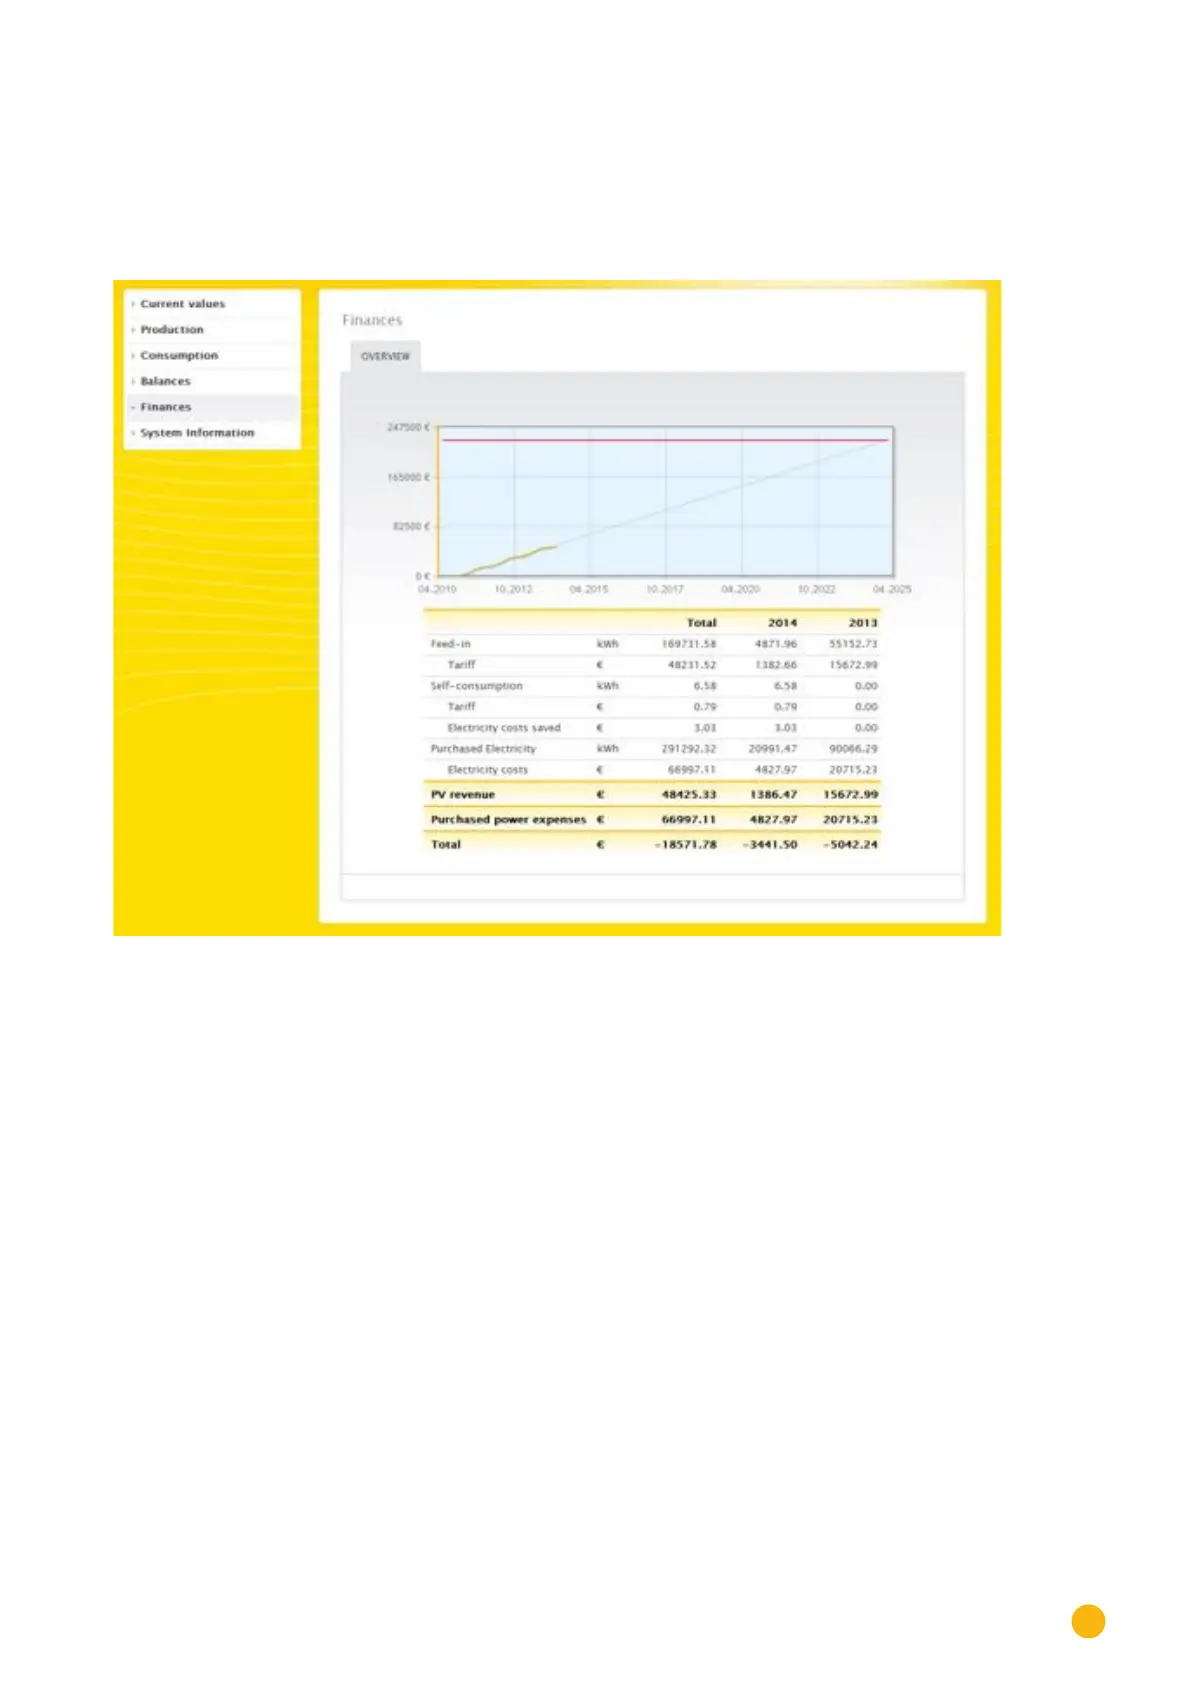
Fig.: Finances overview
The total financial performance of your plant is displayed as a graphic with the actual/target value curve in
the overview.
The following values are displayed for each individual year and the total for all of the years since the Solar-
Log™ started monitoring the plant:
•
Feed-in:
This displays the amount of generated power in kWh that has been fed into the public grid.
•
Tariff:
The tariff calculates the financial compensation for the feed-in amounts based on the rate and currency
defined in the Configuration | Plant | Tariff settings.
•
Self-consumption:
This displays the amount of generated power in KWh that has been consumed locally.
•
Tariff:
Based on the rate in the settings for the tariff under Feed-in, this displays the financial compensation for
the self-consumption refund (when such a compensation is allowed).
•
Electricity costs saved:
This displays the electricity costs saved with self-consumption (power that did not have to be obtained
from the grid).
•
Power consumption:
This displays the amount of power consumed that was obtained from the grid.
•
Electricity costs: