EasyManuals Logo

Solar-Log 2000 User Manual

Solar-Log 2000
158 pages
To Next Page IconTo Next Page
To Previous Page IconTo Previous Page
Page #28 background imageLoading...
Page #28 background image
28
Operating via a web browser within your own network
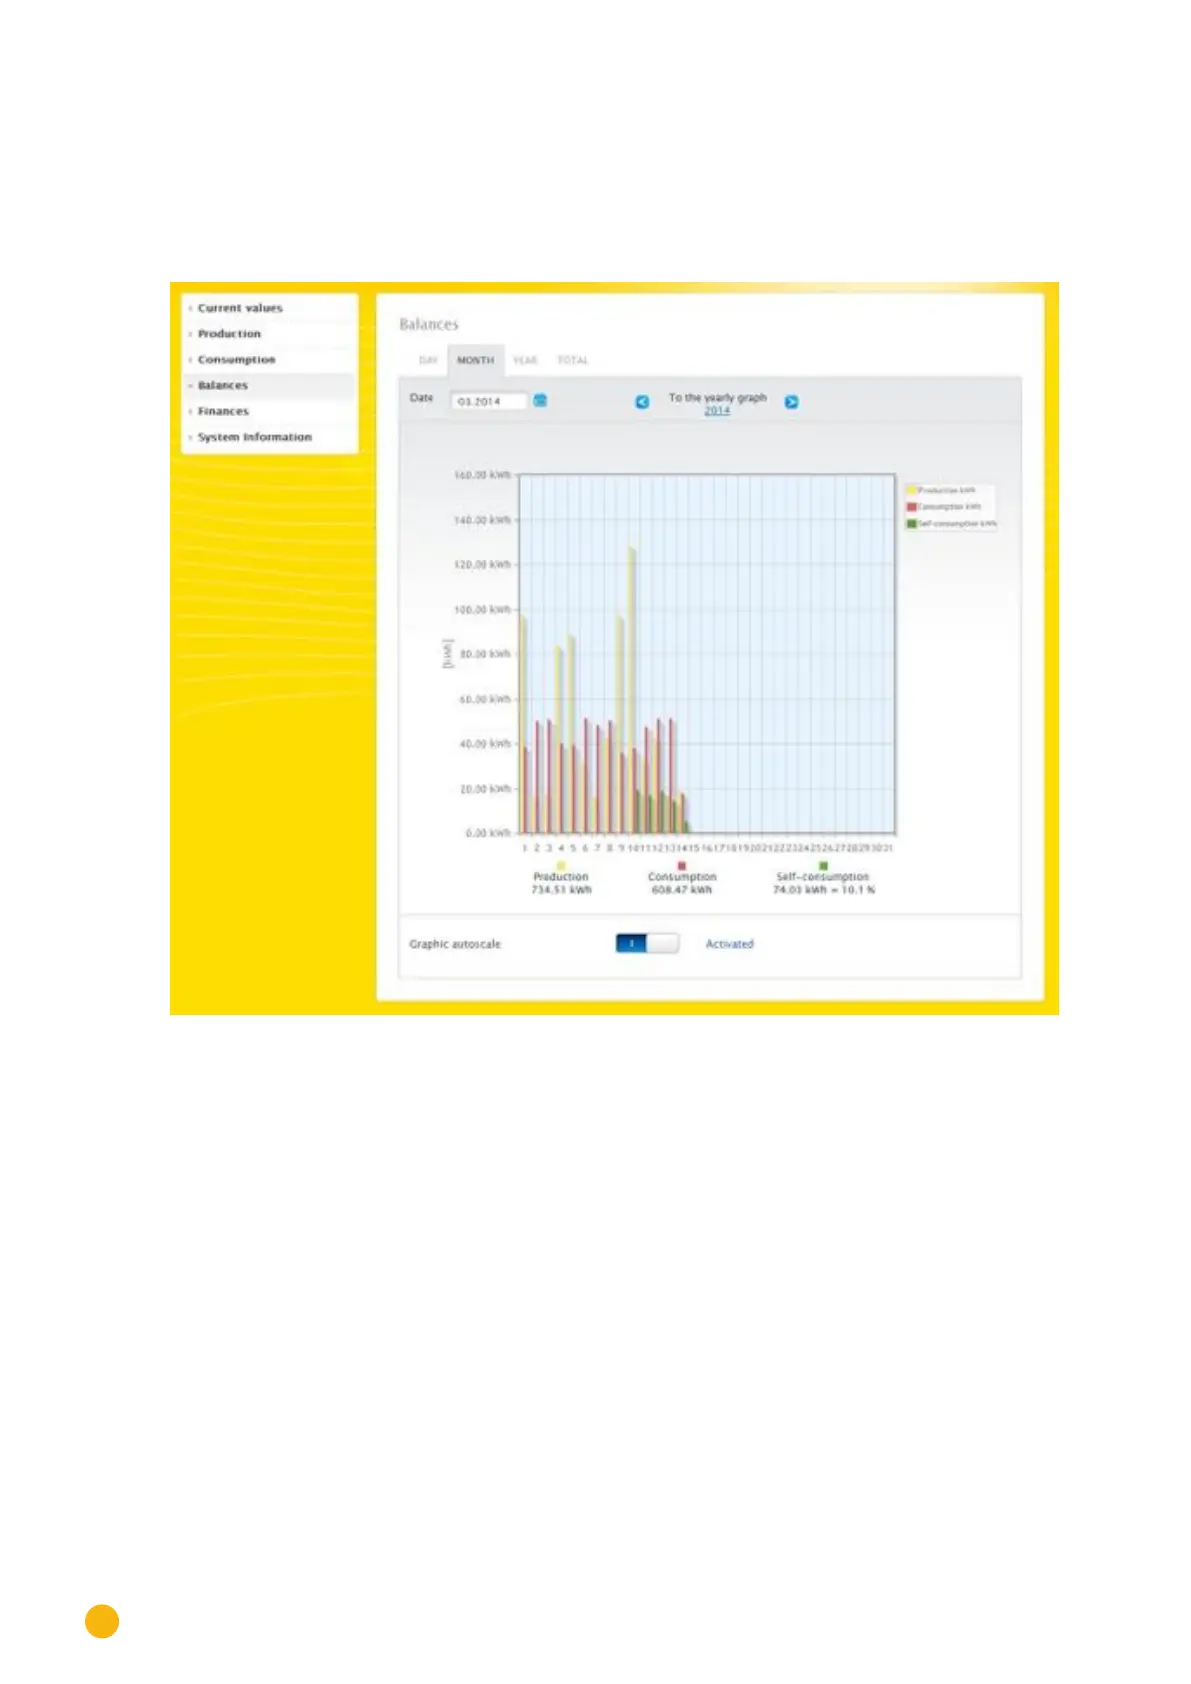
2.6.2 Month balance
The tab Month under balances displays the production and consumption side-by-side in a bar graph.
•
Move the mouse above one of the bars to view either the daily yield or consumption.
•
Click on one of the bars to go to the corresponding day view.
Fig.: Month view balance graph

Table of Contents

Other manuals for Solar-Log 2000

Questions and Answers:

Question and Answer IconNeed help?

Do you have a question about the Solar-Log 2000 and is the answer not in the manual?

Solar-Log 2000 Specifications

General IconGeneral
Device TypeData Logger
Max Inverters100
Power Supply24 V DC
Remote MonitoringYes
Ethernet interfaceYes
Communication InterfacesRS485, Ethernet
ProtocolsModbus
Data StorageInternal

Related product manuals