16
Operating via a web browser within your own network
You can select to display the view as a Graph or Table. The values displayed in the graph or table depend
on the view selected.
Note!
The auto scaling option always scales the graphics up as much as possible in the
yield data section. The auto scaling can be manually disabled for the respective
graphics. Then the scaling is done based on the value defined in the device con-
figuration. (Refer to the chapter "Configuring Inverters" in the Installation Manual)
2.5.1 Day view
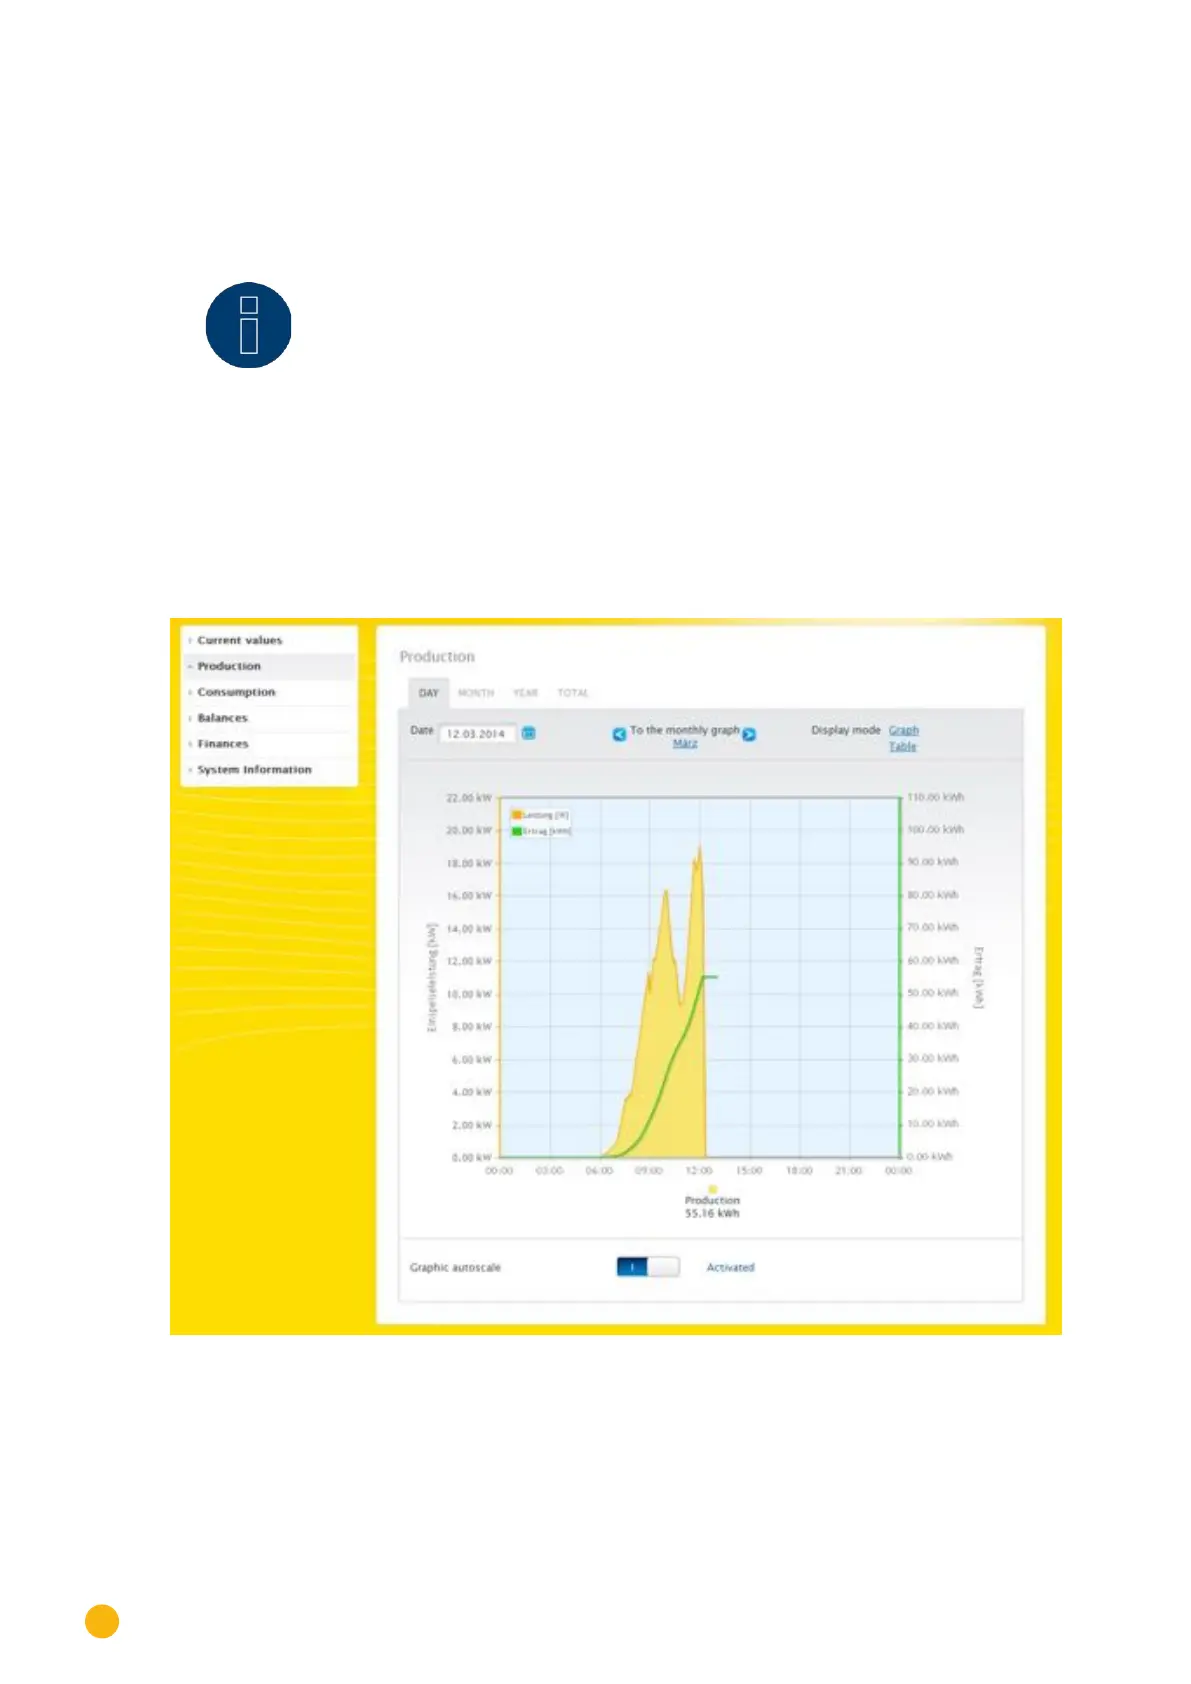
The Day tab displays the current day as a curve graph. The output (W) and yield (kWp) values, at the top
left of the graph key, can be hidden and unhidden by clicking on them.
The different values throughout the day can be displayed by moving the mouse along the curve.
Fig.: Daily View of the Production Graph with the Auto Scaling activated