74
Operating the Solar-Log 500 and 1000 via the Display
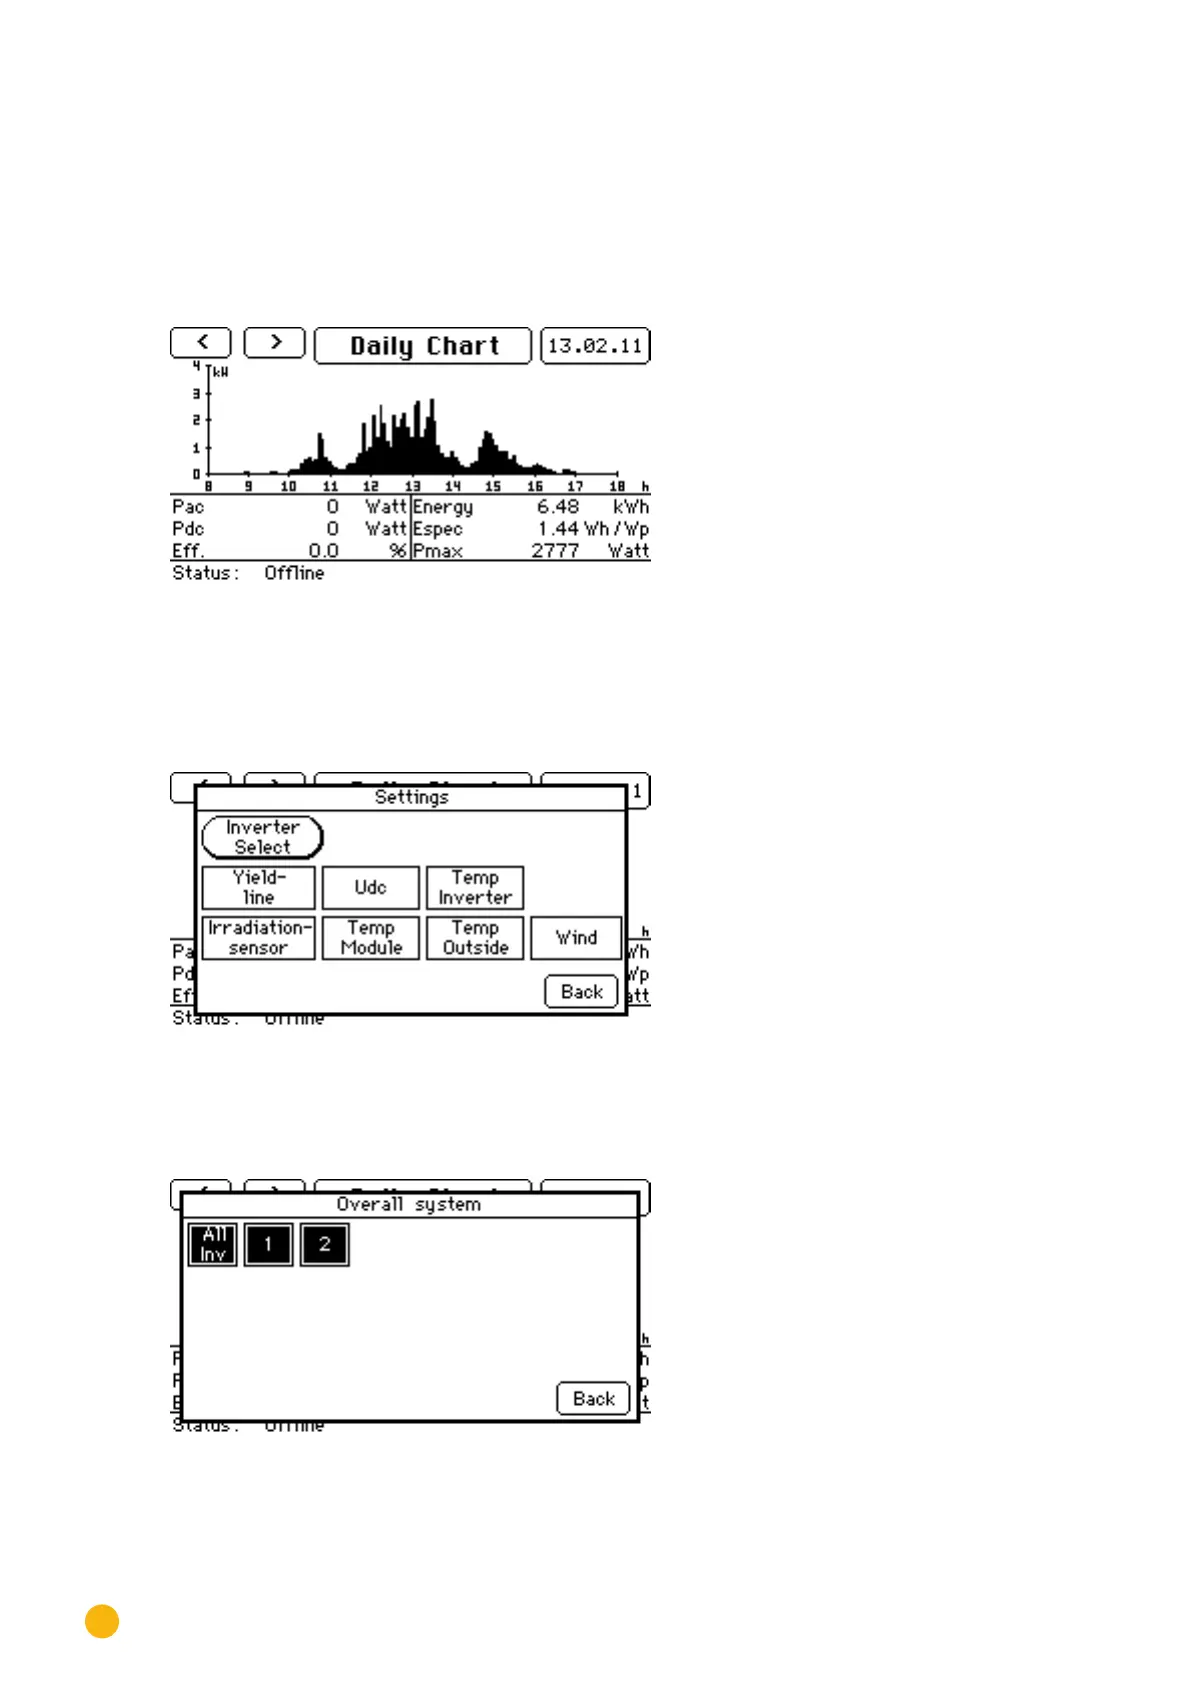
5.4.3 Daily Graph
Tap your finger on the display.
•
The main navigation screen is displayed.
Tap on Graph and then on the Day.
Fig.: Daily Graph
Tap on the day's date to display the information for that day.
Tap on the Daily Graph to display the yield values for the connected inverters.
•
The settings menu window is displayed.
Fig.: Graphic Settings
Tap on INV Selection to select the desired inverter.
•
The total plant menu window is displayed.
Fig.: Total Plant Graphic