15
Operating via a web browser within your own network
•
The current day curve (graph on the left). There is also the option to display the previous five days
as a curve in this graph. Therefore just click on the day value in the graph on the right.
•
The current day value as well as those from the previous 5 days (graph on the right). Move the
mouse above one of the bars to display the day value. Click on one of the bars to have it display in
the graph on the left as a curve.
Below the graphs, there is a table that displays the measured output from the devices connected:
•
The current output from each individual inverter.
•
The total current consumption as measured by the consumption meters.
•
The current irradiation per m
2
as measured by the sensor.
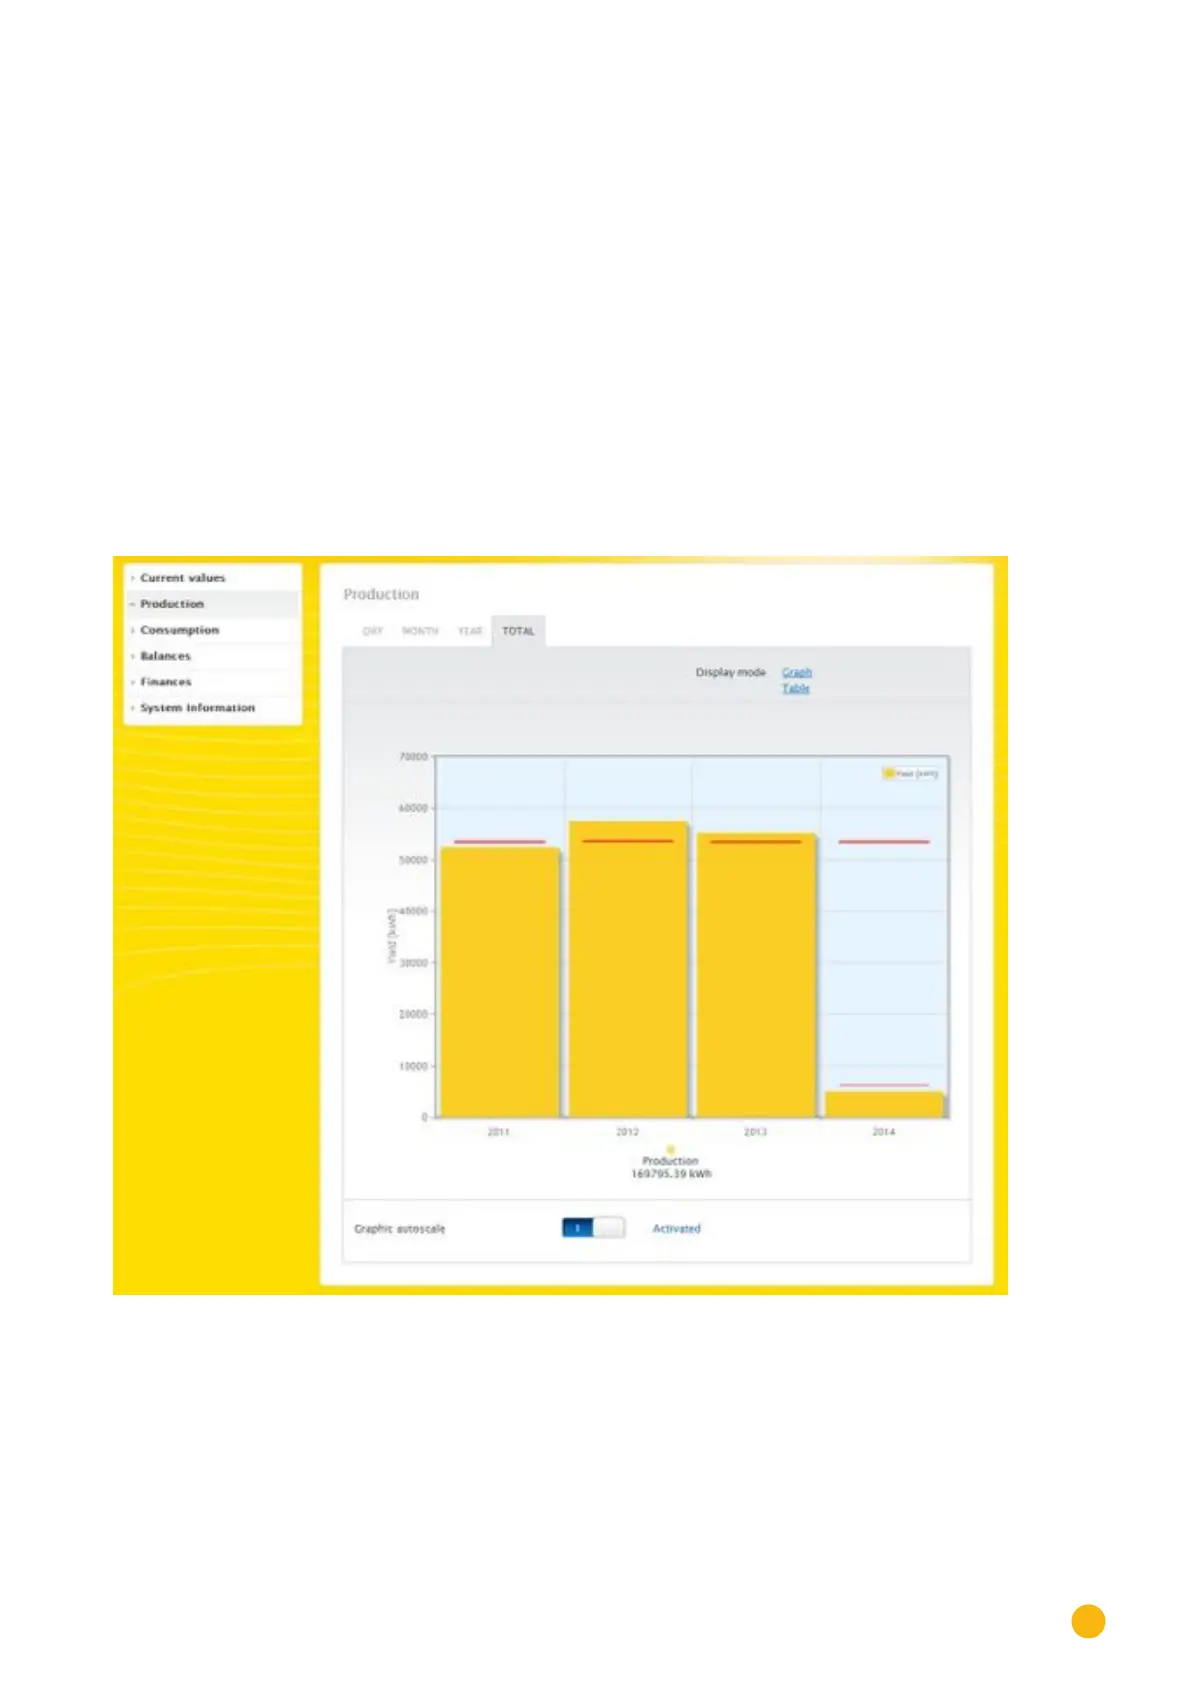
2.5 Production
You can select a graphic display of your plant's production from the Production menu.
Fig.: Graphic display of the plant's total production
From this display, you can select the following tabs:
•
Day
•
Month
•
Year
•
Total

 Loading...


