76
Operating the Solar-Log 500 and 1000 via the Display
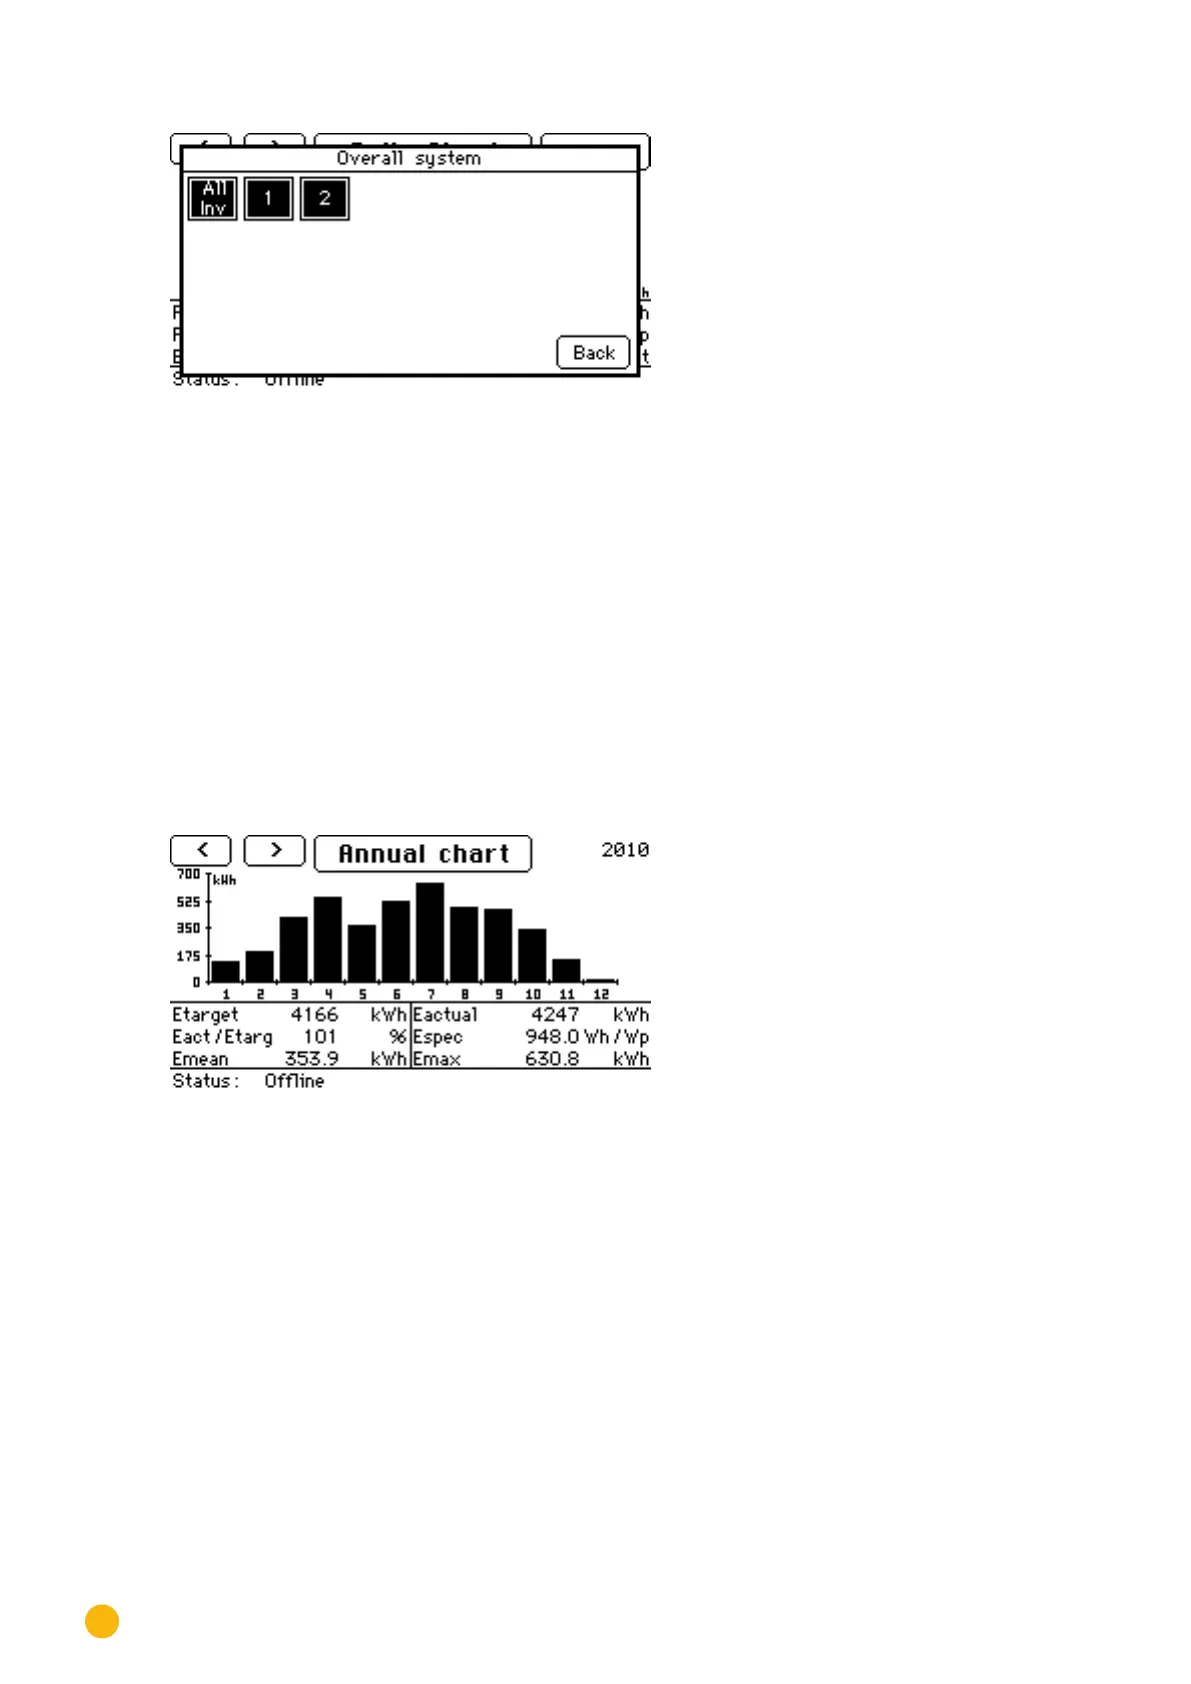
Fig.: Total Plant
Select the desired inverter and tap on
Back.
•
The values from the selected inverter are displayed.
Tap on the display to access the Main Navigation.
5.4.5 Yearly Graph
Tap your finger on the display.
•
The main navigation screen is displayed.
Tap on Graph and then on the Year.
Fig.: Yearly Graph
The yearly graph displays the current values for the selected year.
Tap on the displayed bar to view the Monthly Graph for the selected month.
Tap on the Yearly Graph to display the yield values for the connected inverters.
•
The total plant menu window is displayed.