26
Operating via a web browser within your own network
Balances
You can see the relationship between your plant's production and consumption from the Balances menu.
Note!
Consumption is only displayed once a meter is connected.
Note!
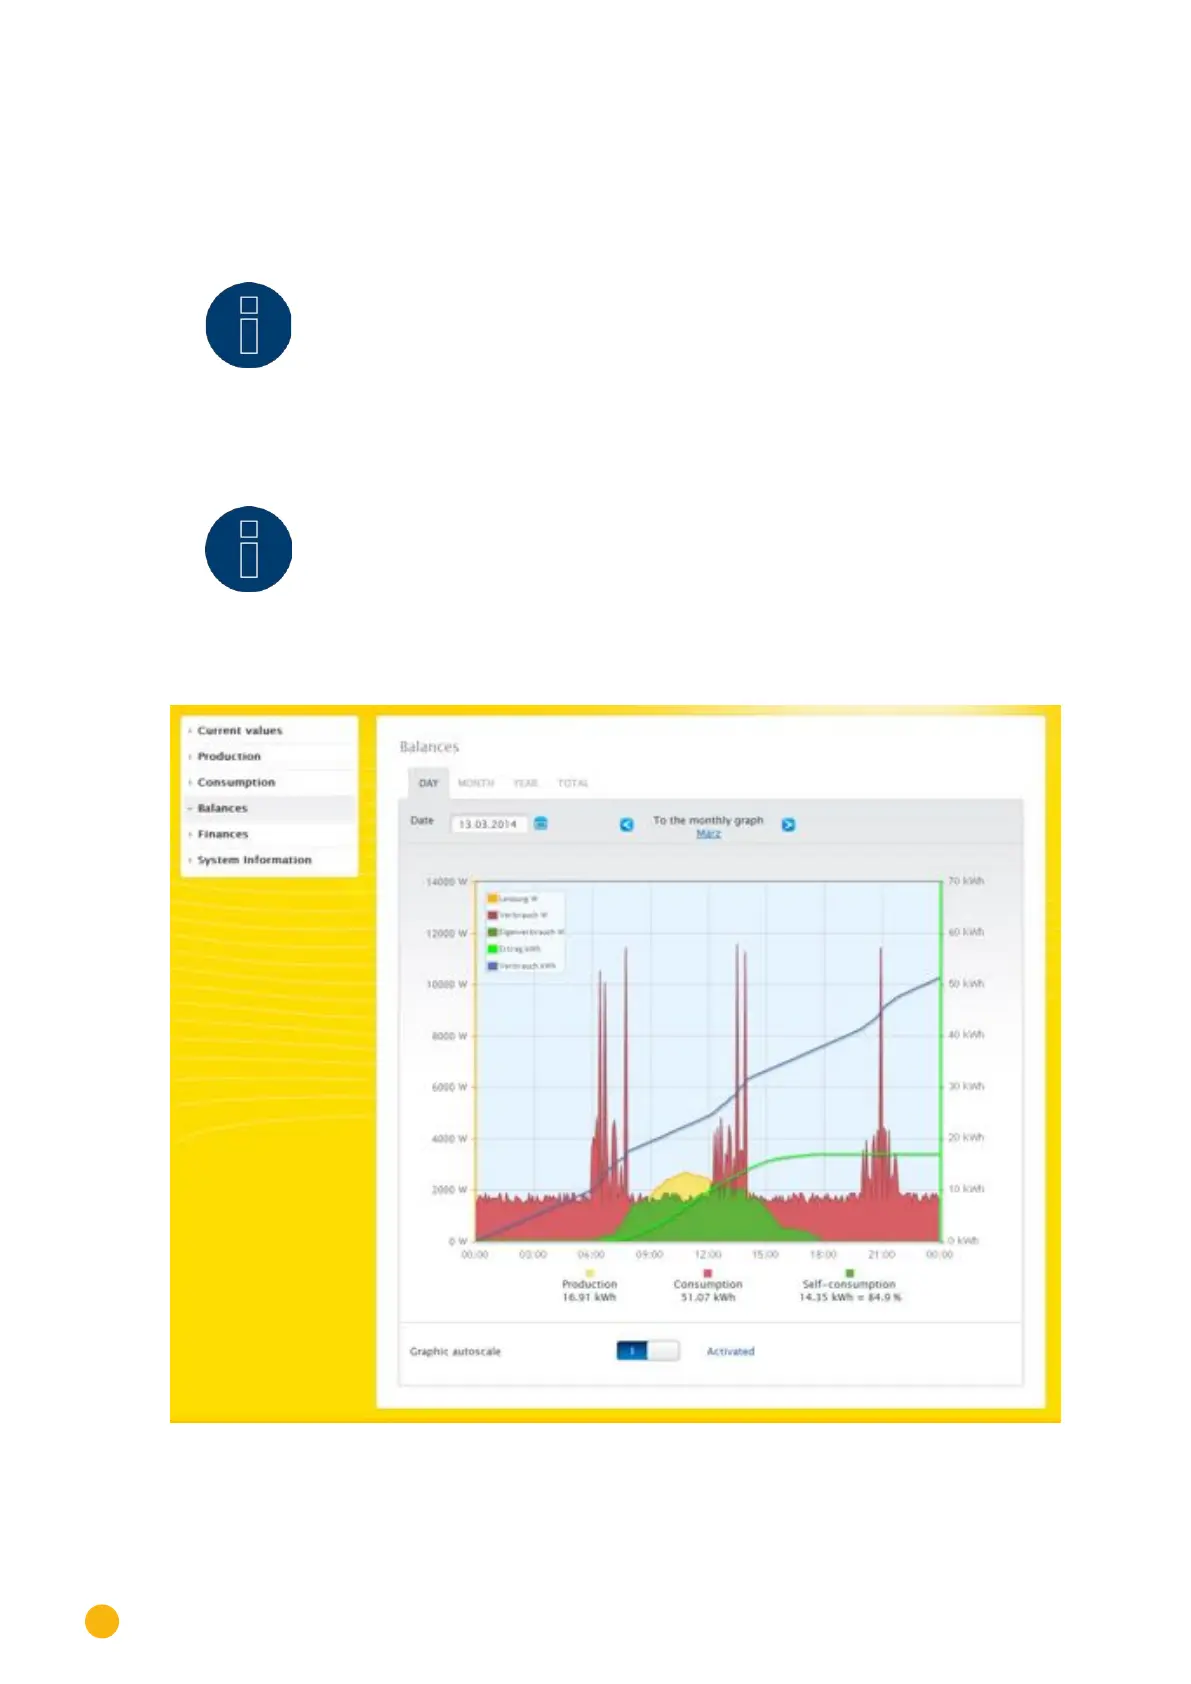
The auto-scaling option always scales the graphics up as much as possible in the
yield data section. The auto scaling can be manually disabled for the respective
graphics. Then the scaling is done based on the value defined in the device con-
figuration. (Refer to the chapter "Configuring Inverters" in the Installation Manual)
Fig.: Daily Balance Graph with the Auto Scaling activated