Spectroquant
®
Pharo 300 Operation
91
ba75703d07 04/2014
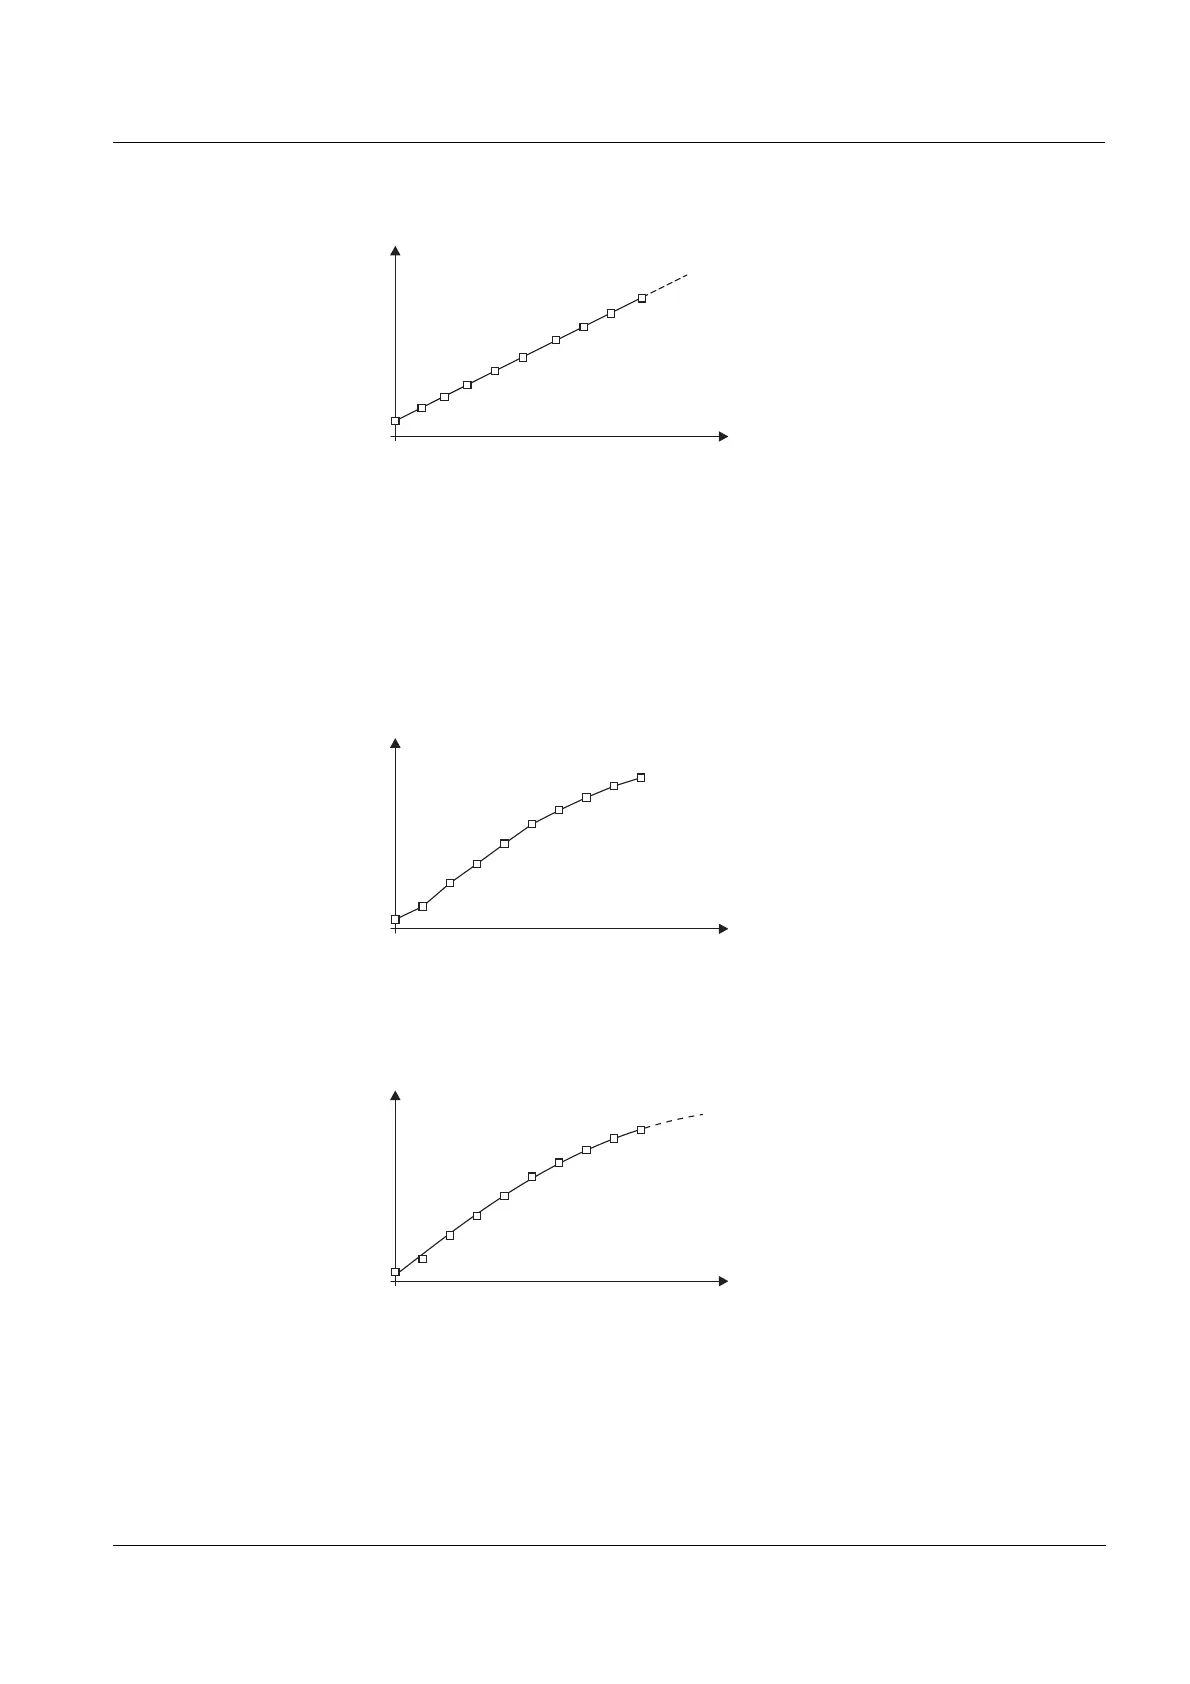
figure 4-2 Example of a linear calibration function after a 10-point calibration
In the case of a linear dependency, the calibration function is determined by
means of linear regression. The slope and axis intercept (E0) are the charac-
teristics of the calibration line.
In the case of a nonlinear dependency, the points of the measuring ranges
can be connected to each other as a polygon line or approximated as a
parabola:
figure 4-3 Example of a polygon line calibration function after a 10-point calibration
figure 4-4 Example of a parabola calibration function after a 10-point calibration
0
0
Nominal value (e. g. concentration)
Absorbance
0
0
Nominal value (e. g. concentration)
Absorbance
0
0
Nominal value (e. g. concentration)
Absorbance