12 Software description
CyFlow
®
Cube 8 | Operating Manual | May 2018 | Revision 032 133
Show Plot: The button is available when one or more plots are selected
in the Galleries area. Select this option to display the selected plots in the
overlay plot. Deselect this option to remove selected plots from the
overlay plot. Any plots in the gallery which are not hidden will display a
"Not Displayed" icon in the Galleries area. This icon is not visible in
reports or copied and pasted images.
Overlays group
The Overlays group contains buttons to switch the available views for the
overlay plot from overlay mode to 3D mode. The buttons are available when
one or more plots are selected in the Overlays area. The highlighted button
indicates the current mode of the selected plot(s). When different modes are
present in the selected plots, no button will be highlighted.
The Overlays group contains the following options:
Overlay Mode: Click the button to change all selected overlay plots to
display in overlay mode.
3D Mode: Click the button to change all selected overlay plots to display
in 3D mode.
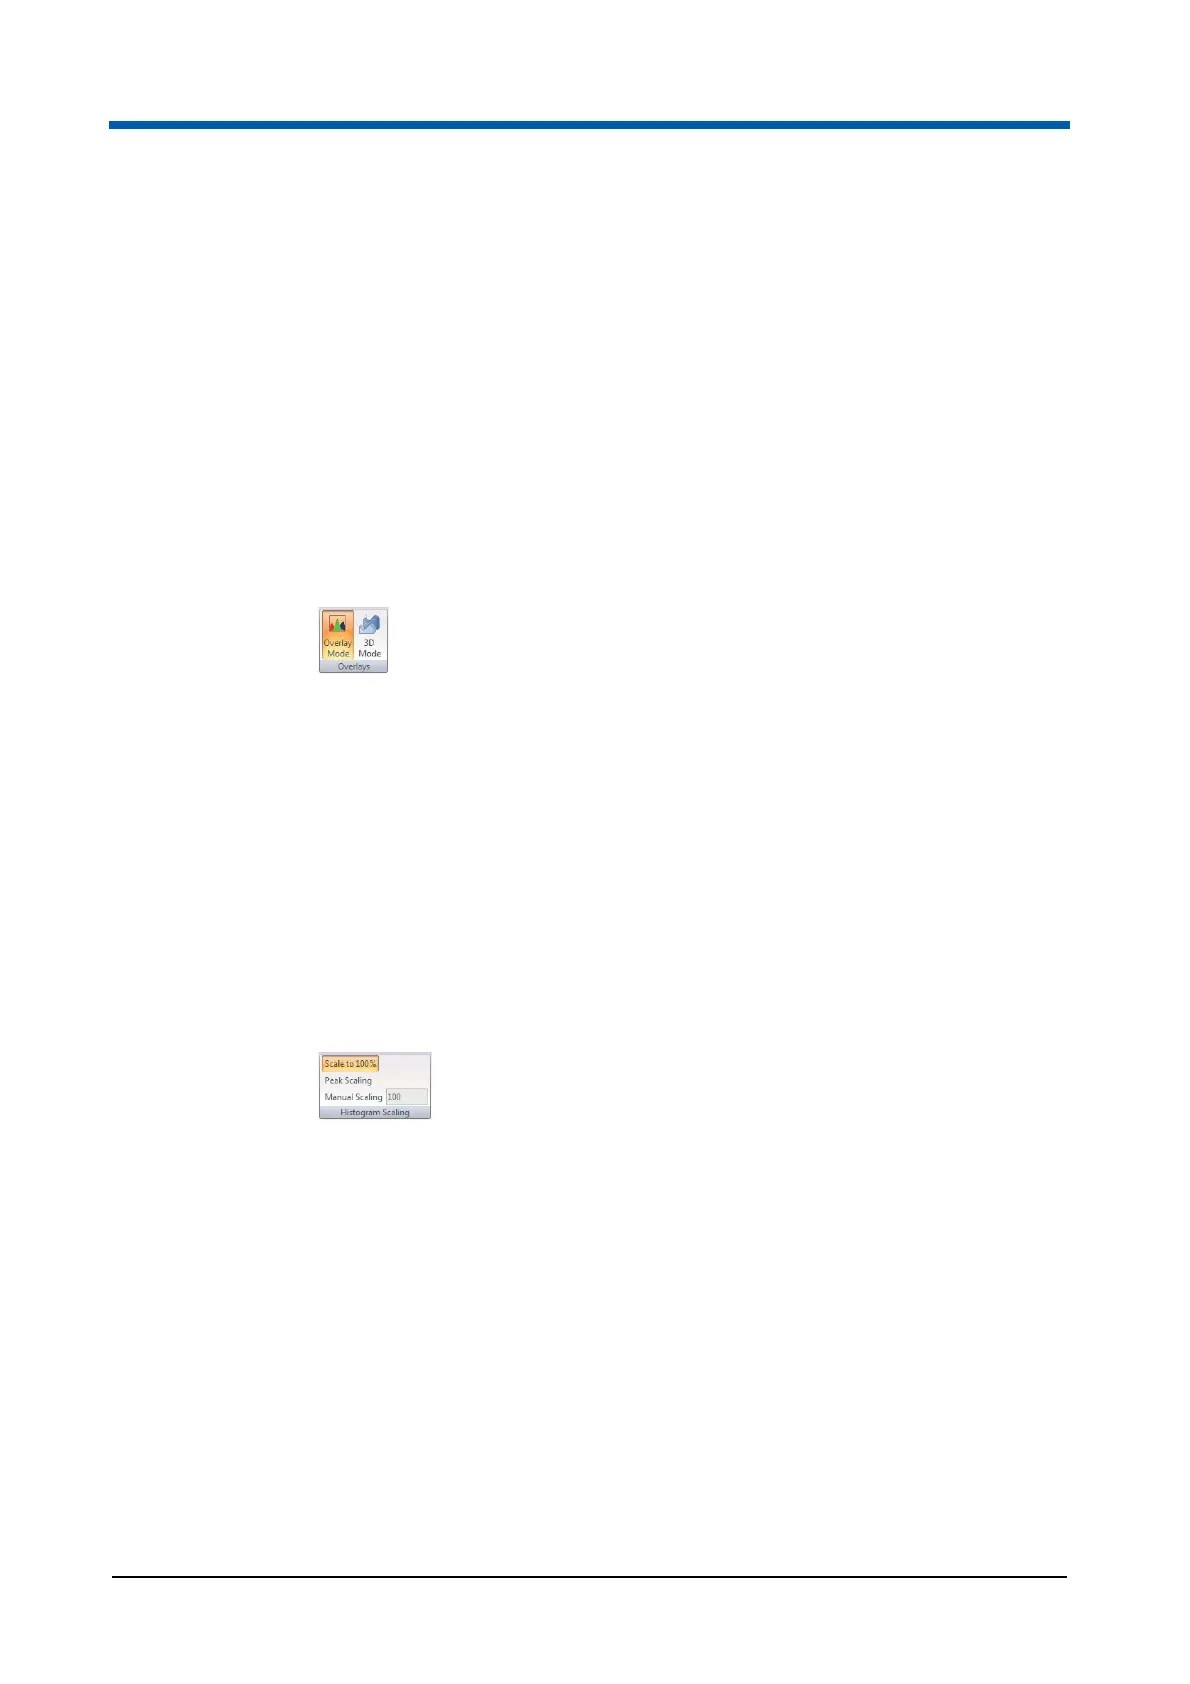
Histogram Scaling group
The Histogram Scaling group contains options to control the scale settings
for histograms in both the Overlay and Galleries areas. These options are
mutually exclusive. Select an overlay plot to apply the selected scale option
to all gallery plots of the selected overlay plot. Select one or more gallery
plots to apply the selected scale option to only the selected plots.
The Histogram Scaling group contains the following options:
Scale to 100%: The option scales all selected plots to their maximum
values. If a control plot is present in the Galleries area, the control and
test histograms are each scaled to their maximum values.
Peak Scaling: The option is only useful if a control plot is present in the
Galleries area. When this option is selected, the control and test
histogram are both scaled to the highest scale factor of either histogram.
If no control plot is set, "Scale to 100%" and "Peak Scaling" have the
same values.
Manual Scaling: The option will apply the selected custom value to all
selected plots. Enter a value and press Enter to apply that value to all
selected plots.