. . . . .
ROUTINE MAINTENANCE
RTD Sensor Calibration (DUT Mode)
TP04300 Series Interface & Applications Manual 5-37
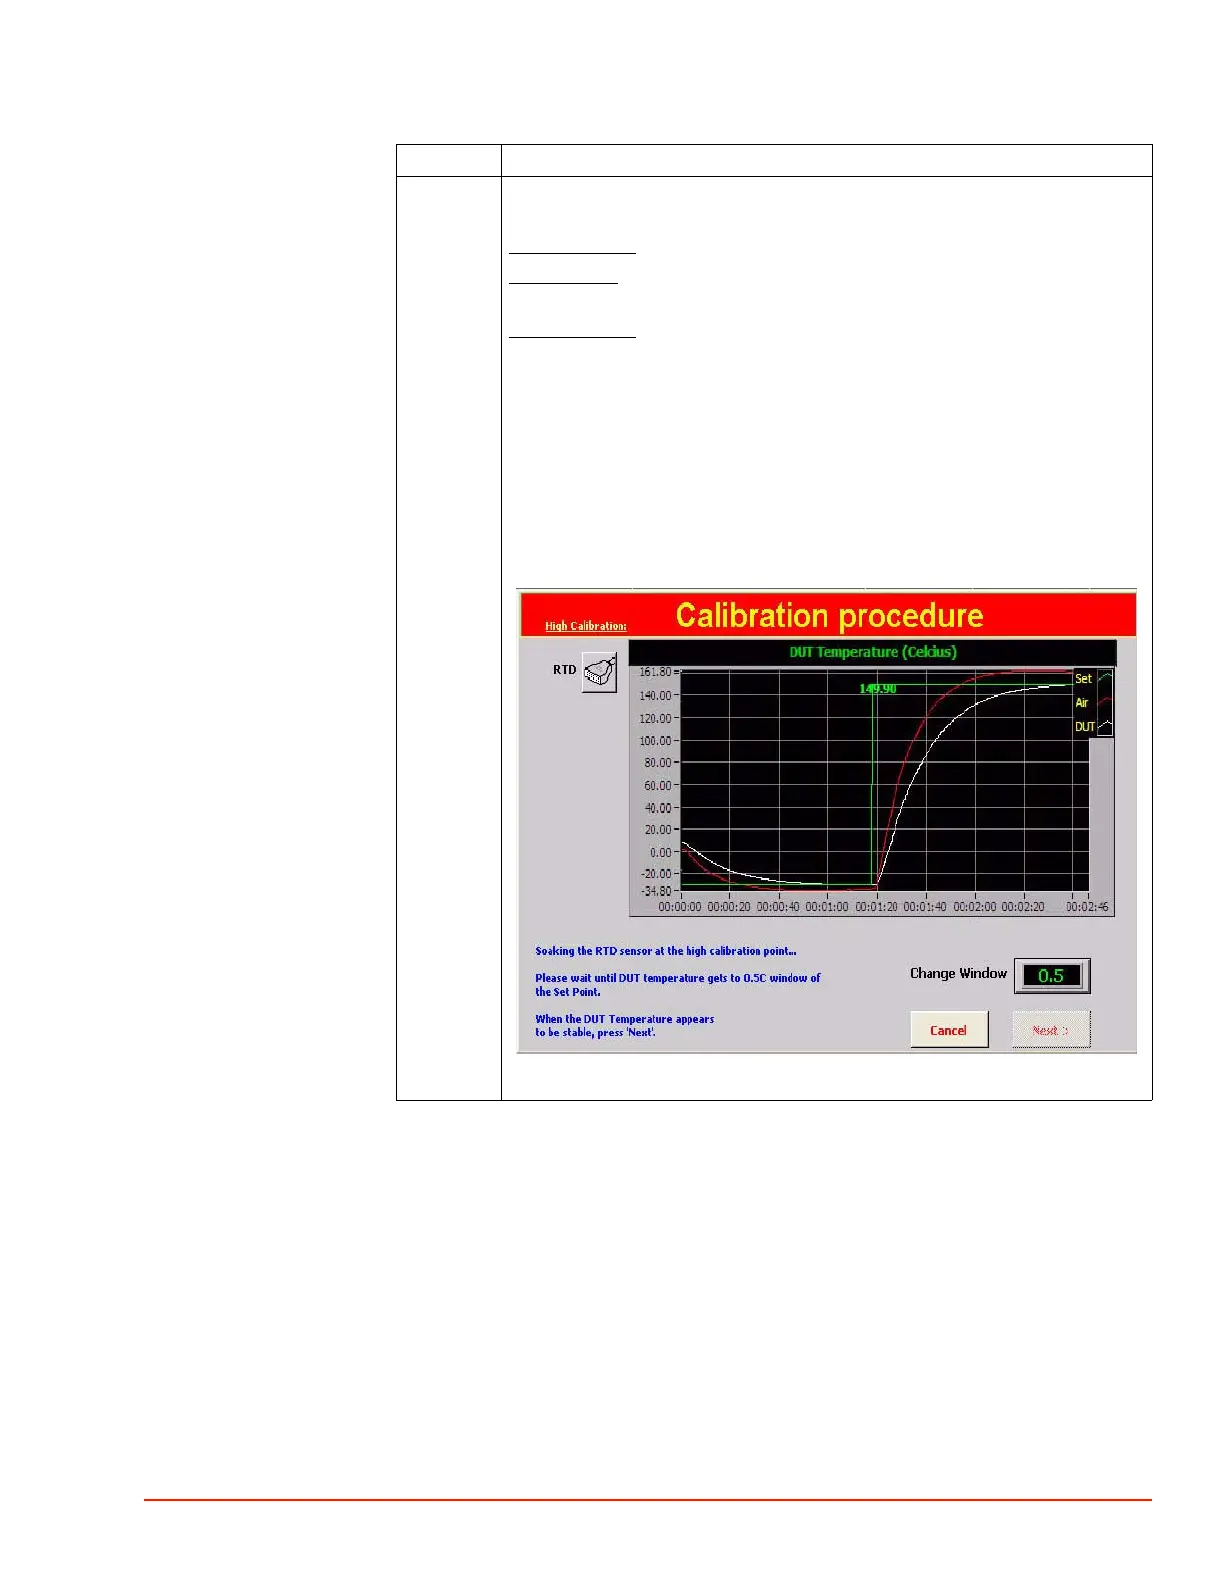
9 As the System ramps to the High Calibration Setpoint, progress can be
monitored on the Calibration graph:
The Green Line
- represents the desired setpoint (150.0 in the example below)
The Red Line
- represents the Main Air Temperature. The Main Air will control
the DUT at the desired setpoint.
The White Line
- represents the DUT. The DUT (white) will eventually match
the Setpoint (Green).
The Change Window is the range above/below the setpoint at which the
system is “At Temperature”. Values between 5.0 and .5 may be entered into the
Change Window.
The Next button will become available once the temperature has settled within
the parameters of the Change Window.
Press NEXT when the DUT Temperature is within the Change Window and
appears stable.
1980_521.jpg
Step Action
 Loading...