Scanning spectra 3-53
possible resolution for the specified pace. As shown by the following
table, the higher the pace value, the poorer the resolution.
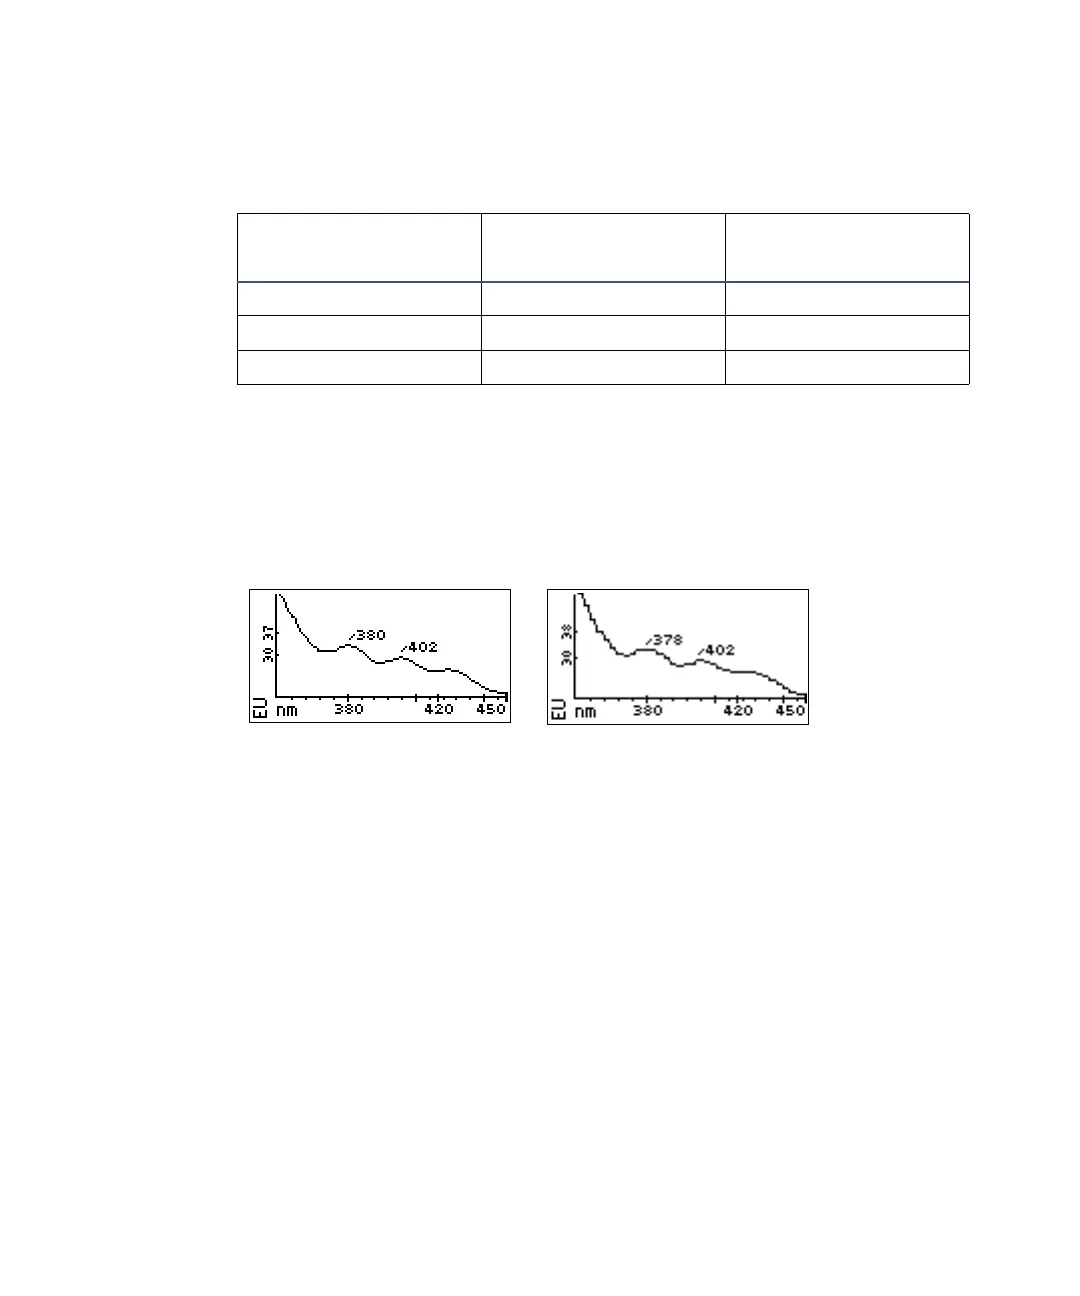
The following figure shows two emission scans of anthracene. At a pace
of 1000 nm/min, the second scan (right) shows a reduced number of
points scanned. Thus the resolution is diminished relative to that in the
original scan (left) at a pace of 100 nm/min.
Scans of anthracene at 100 nm/min and 1000 nm/min
• Tick marks – Generates tick marks at a specified wavelength interval,
which helps to interpret charted data. The figure “Scan of water without
tick marks” on page 3-54 shows a scan of water standard in a cuvette
from 390 to 455 nm at a pace of 200 nm/min without tick marks. The
figure “Scan of water with tick marks” on page 3-54 shows the same scan
with tick marks every 20 nm.
• EUFS – The sensitivity setting for scaling the charted spectrum.
Pace and sampling resolution examples
Pace (nm/min)
Emission sampling
resolution (nm)
Excitation sampling
resolution (nm)
100 and less 0.7 0.9
200 1.4 1.8
400 2.8 3.6
Pace = 100 nm/min Pace = 1000 nm/min