5.3 Monitoring Machine Operation
5.3.4 XY Trace
5-68
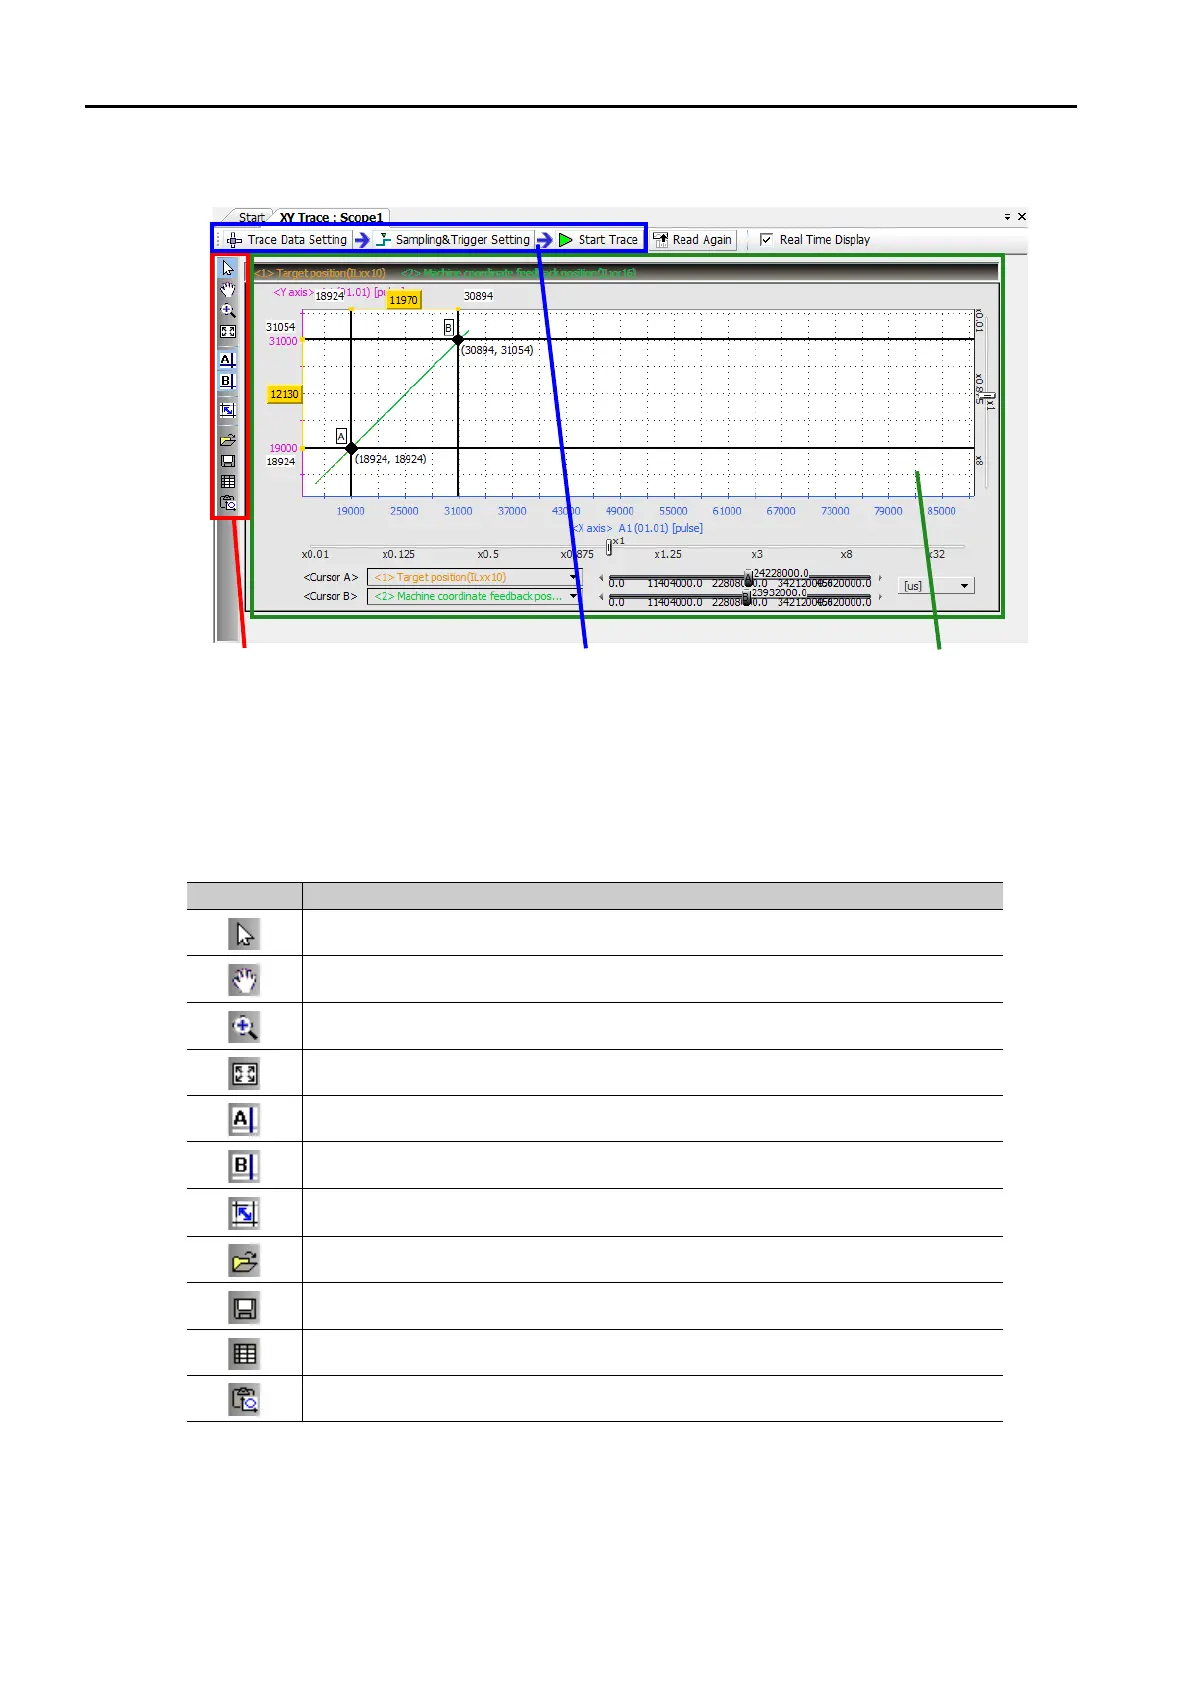
Names and Functions of the XY Trace Tab Page Items
Graph Toolbar
The following table gives details on the icons.
Icon Function
Click the Select Icon, and then double-click the target area to enlarge the display.
Click the Scroll Icon to move the target area. Double-click the target area to enlarge
the display.
Click the Zoom In Icon, and then drag or double-click the target area to enlarge the
display.
Click the Reset Icon to return to the original display of the graph.
Click the Cursor A Icon to display cursor A, and then move it on the graph to display
the X and Y values.
Click the Cursor B Icon to display cursor B, and then move it on the graph to display
the X and Y values.
Click the Cursor AB Link Icon to lock the horizontal distance between cursors A and
B, and to move them together at a fixed width.
Click the Open External File Icon to display the Open Dialog Box and read the trace
data from a file.
Click the Save Icon to display the Save Dialog Box so that you can save the file with
a specified name.
Click the List Icon to display the Trace List.
Click the Copy Graph Icon to place a screen capture of the graph on the clipboard.
XY Graph
This graph displays the trace
data.
You can use the Graph Toolbar,
Graph Toolbar
The Graph Toolbar contains
buttons to analyze the trace
data.
Trace Execution Toolbar
This toolbar contains the Trace
Data Setting, the Sampling &
Trigger Setting, and the Start
 Loading...