7-67
IM AQ6370D-01EN
Analysis
7
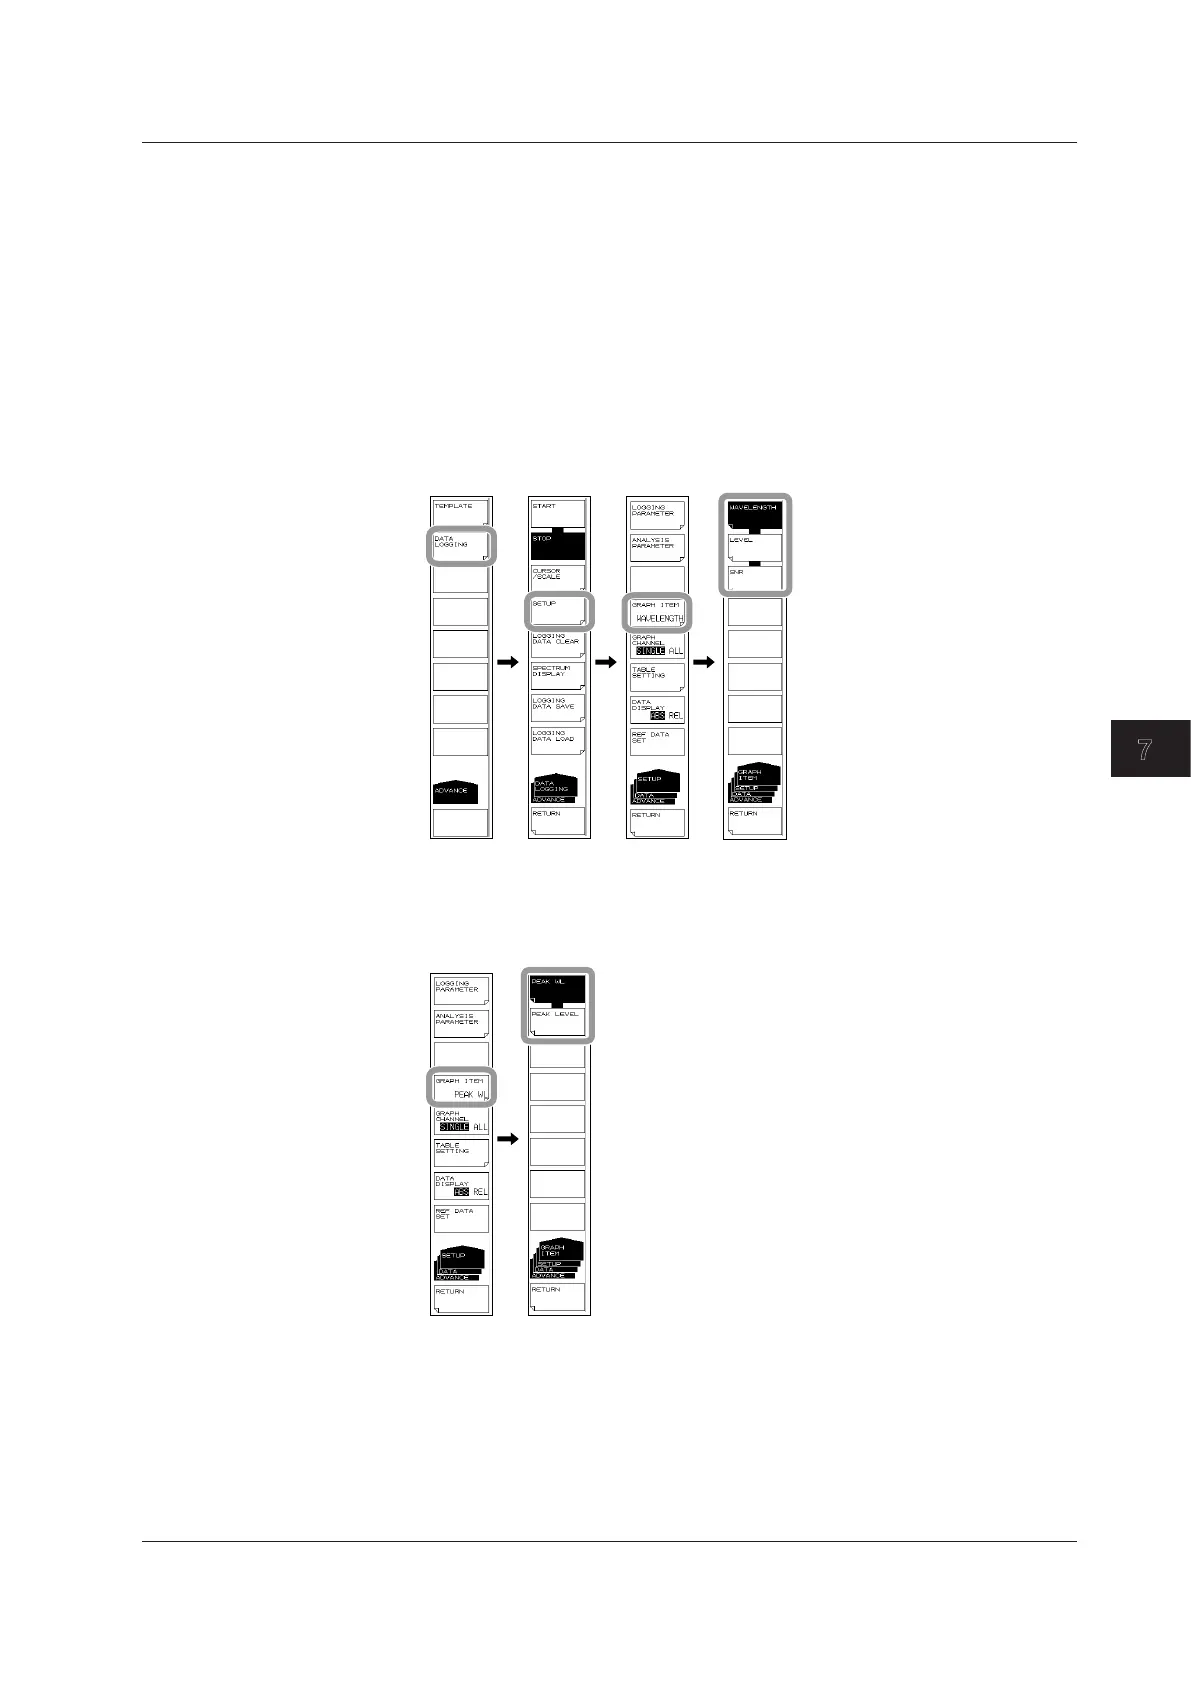
Selecting the Data to Graph
1.
Press ADVANCE and then the DATA LOGGING soft key. The soft key menu for
data logging appears.
2.
Press the SETUP soft key. A menu for setting the data logging conditions appears.
3.
Press the GRAPH ITEM soft key. The displayed menu varies depending on what
is being logged.
When the Logging Item Is WDM
4.
To display the wavelength graph, press the WAVELENGTH soft key. To display
the level graph, press the LEVEL soft key. To display the SNR graph, press the
SNR soft key.
When the Logging Item Is PEAK/MULTI-PEAK
4.
To display the wavelength graph, press the PEAK WL soft key. To display the
level graph, press the PEAK LEVEL soft key.
7.15 Analysis Data Logging
 Loading...