7-68
IM AQ6370D-01EN
When the Logging Item Is DFB-LD
4.
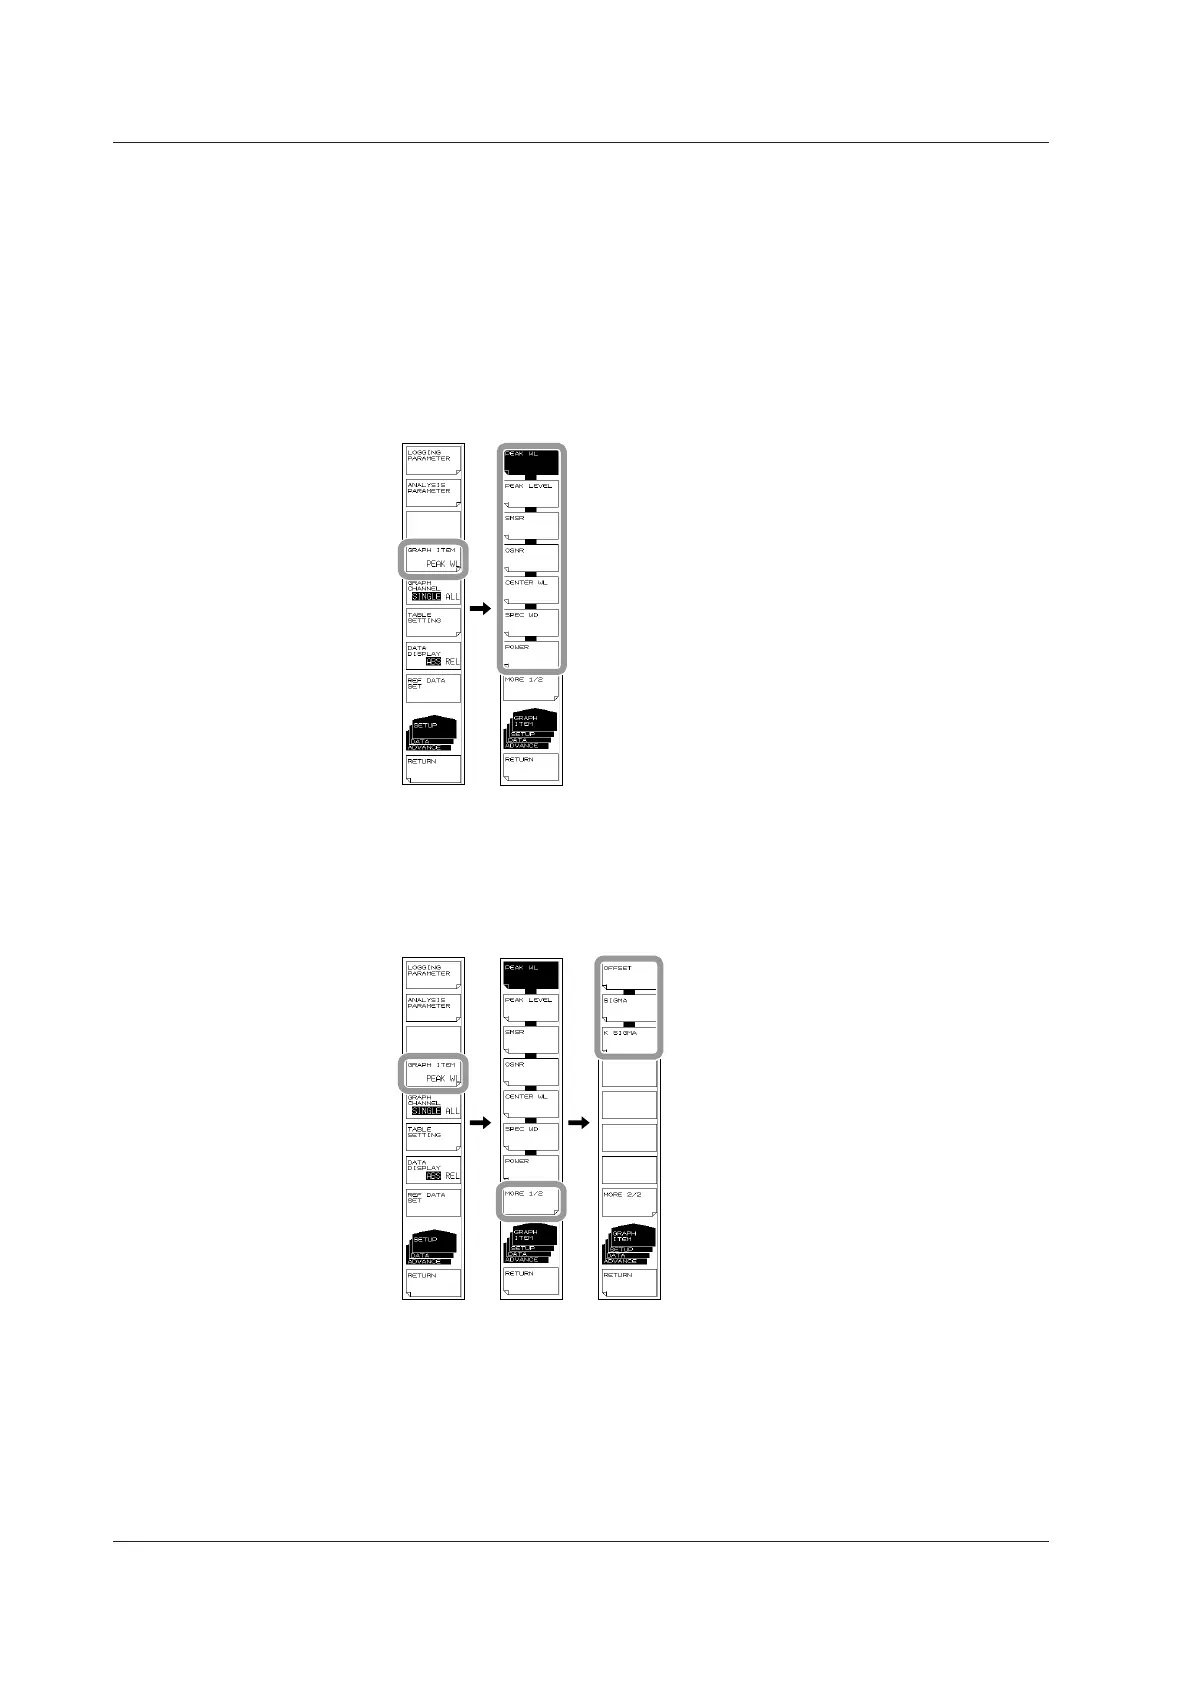
To display the graph of DFB-LD analysis items, press the soft keys below.
• To display the peak wavelength graph: PEAK WL
• To display the peak level graph: PEAK LEVEL
• To display the side mode suppression ratio graph: SMSR
• To display the signal-to-noise ratio graph: OSNR
• To display the center wavelength graph: CENTER WL
• To display the spectral width graph of the center wavelength based on the -XdB
WIDTH (Center WL/SPWD) parameter: SPEC WD
• To display the total power graph: MORE1/2 and then POWER
• To display the mode offset graph: MORE1/2 and then OFFSET
• To display the spectral width (σ) graph of the center wavelength based on the
RMS parameter: MORE1/2 and then SIGMA
• To display the spectral width (Kσ) graph of the center wavelength based on the
RMS parameter: MORE1/2 and then K SIGMA
7.15 Analysis Data Logging
 Loading...