7-72
IM AQ6370D-01EN
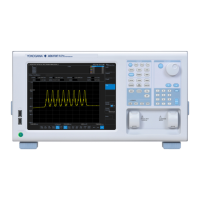
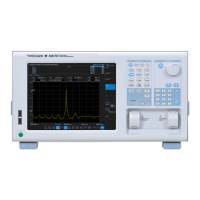
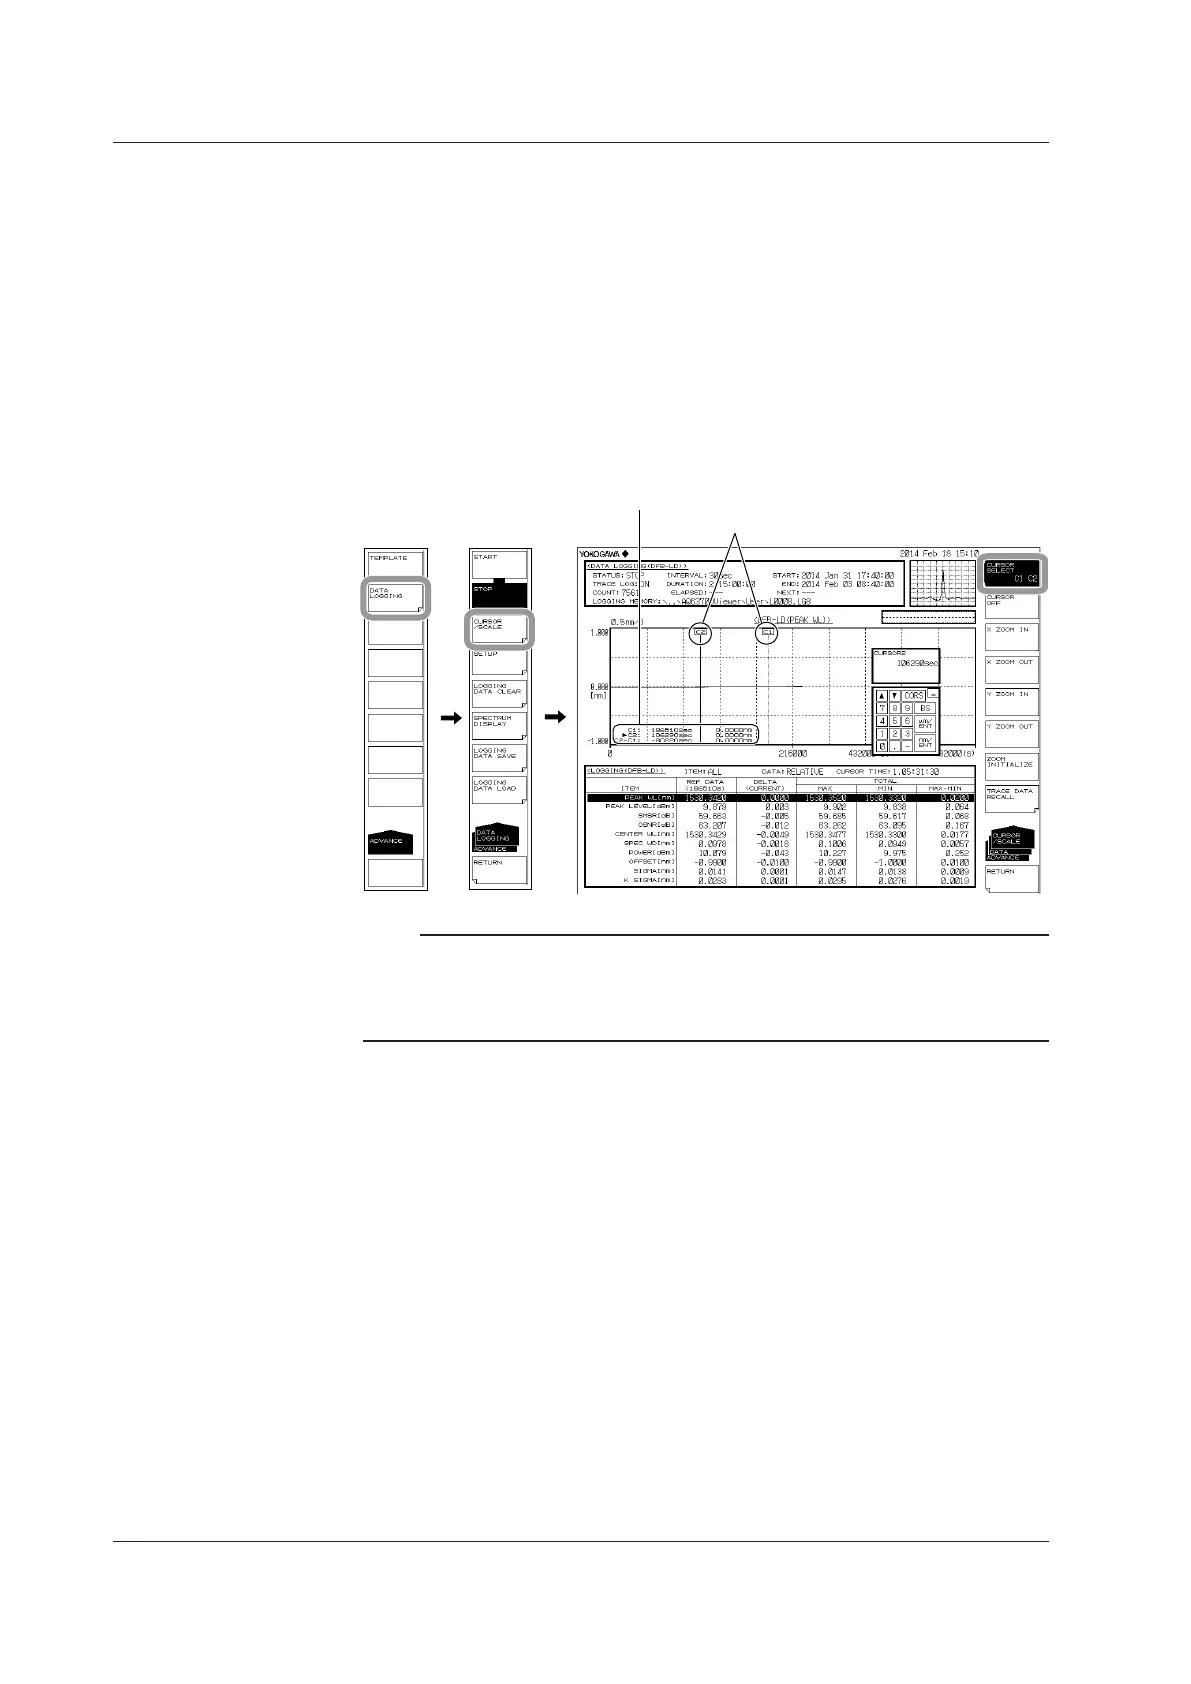
Displaying the Data Logging Results
• Displaying Graph Values Using Cursors
1.
Press ADVANCE and then the DATA LOGGING soft key. The soft key menu for
data logging appears.
2.
Press the CURSOR/SCALE soft key. The cursor/scale soft key menu appears.
3.
Press the CURSOR SELECT C1 C2 soft key. Cursors C1 and C2 appear in the
graph display area, and the cursor values are displayed at the lower right of the
graph area.
Each time you press the CURSOR SELECT C1 C2 soft key, the current cursor
toggles between cursor C1 and C2.
4.
Move the cursor using the rotary knob.
Cursors (C1, C2)
Note
The difference between the two cursor values (C2 – C1) is displayed below the cursor values.
The horizontal axis shows the logging time.
The vertical axis shows the value of the graph data (GRAPH ITEM).
You cannot move the cursors to an area where there is no logging data.
• Clearing the Cursor Display
5.
Press the CURSOR OFF soft key. Both cursors, C1 and C2, are cleared.
7.15 Analysis Data Logging
 Loading...