Devices 81
• Source column shows the source of the event. You can filter this field with a free text
box.
• Severity column defines the severity (or type) of the event (Detail, Notification,
Warning, Fault, Severe). You can filter this field to show only the wanted event types.
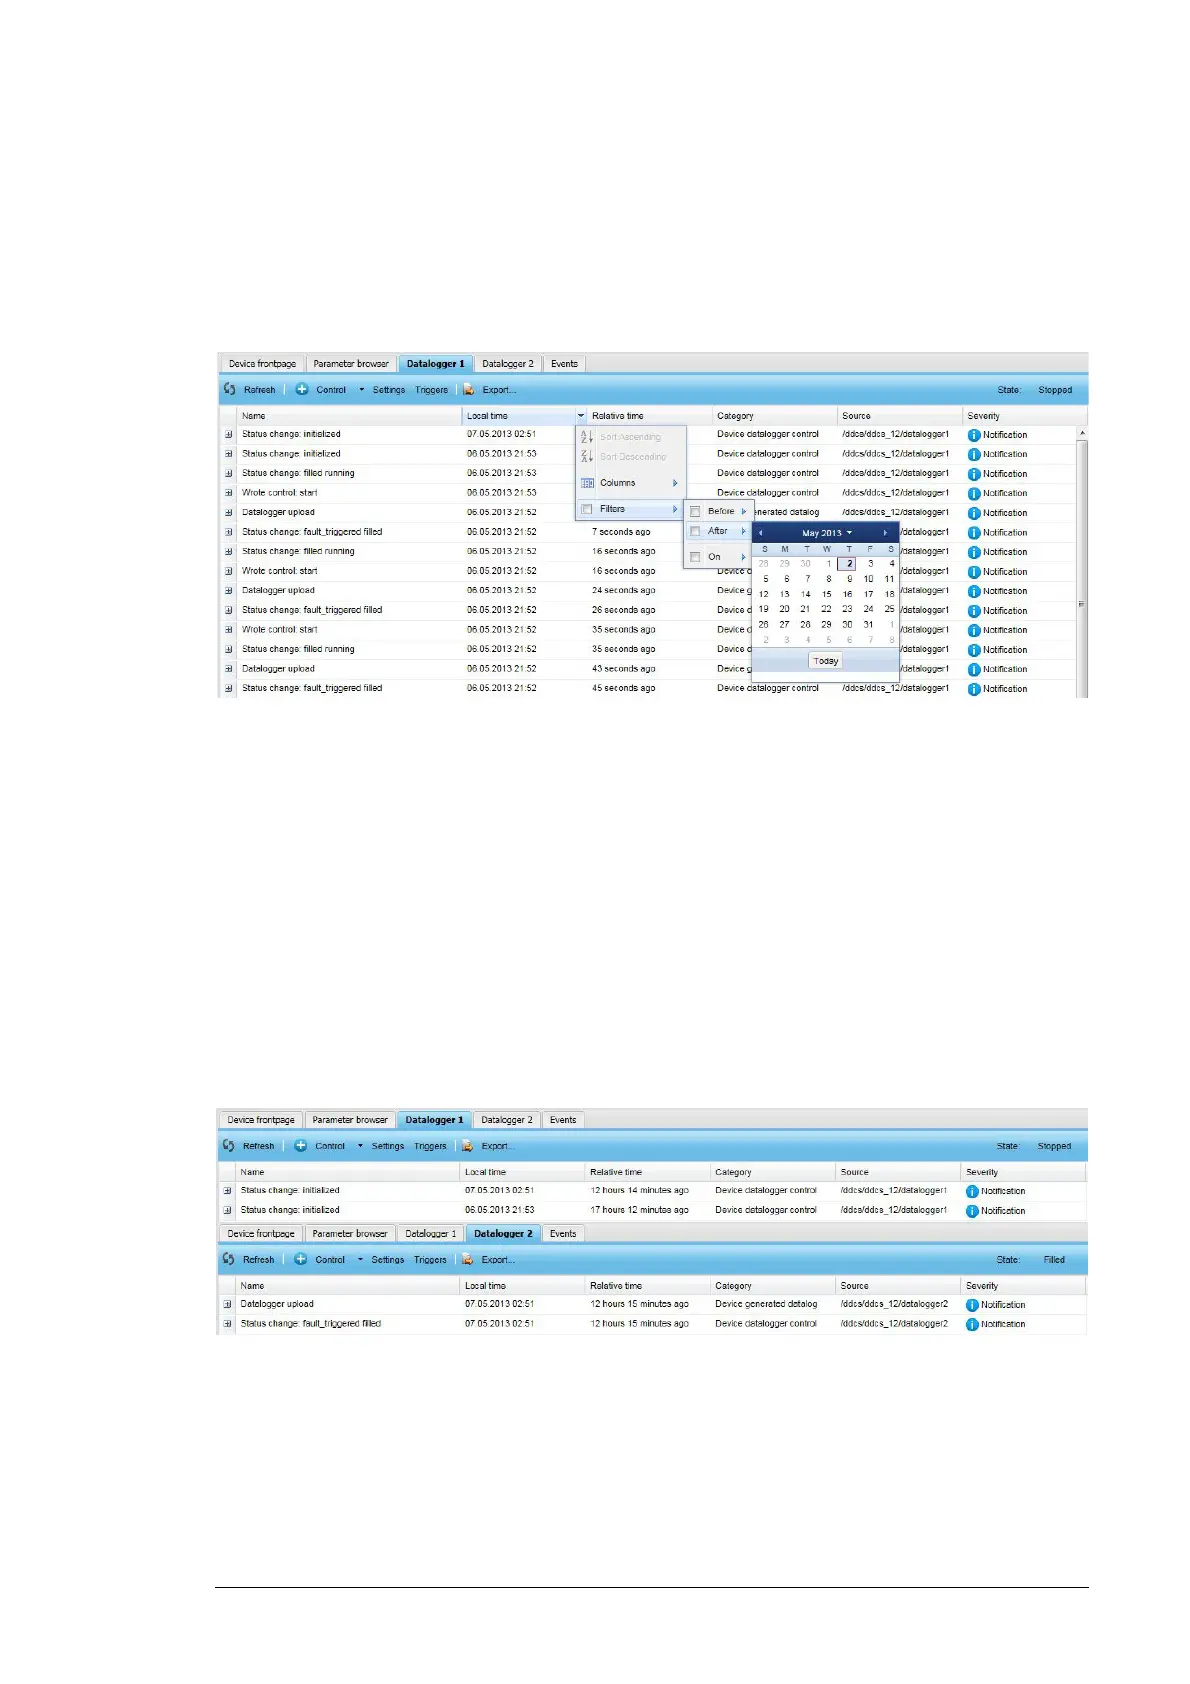
The columns can be sorted, hidden or filtered by clicking the header arrow, which appears
when the cursor is over the header.
The data logger records data before and after the triggering event, depending on its
settings.
For more information on the functionality of data loggers, see the drive-specific firmware
manual.
Opening a data logger
1. Log on as a user with roles other than Guest or Net Admin.
2. Click Devices.
3. Select the device to be monitored with a data logger.
Note: All monitored devices do not provide data loggers. Data loggers are supported if
there is one Datalogger tab or more Datalogger tabs on the device-specific page.
4. Click the Datalogger 1 or Datalogger 2 tab to view the system data logs.