Agilent 1200 Infinity Series DAD User Manual 85
Optimizing the Detector
5
Optimizing for Sensitivity, Selectivity, Linearity and Dispersion
Optimizing for Sensitivity, Selectivity, Linearity and Dispersion
Flow Cell Path Length
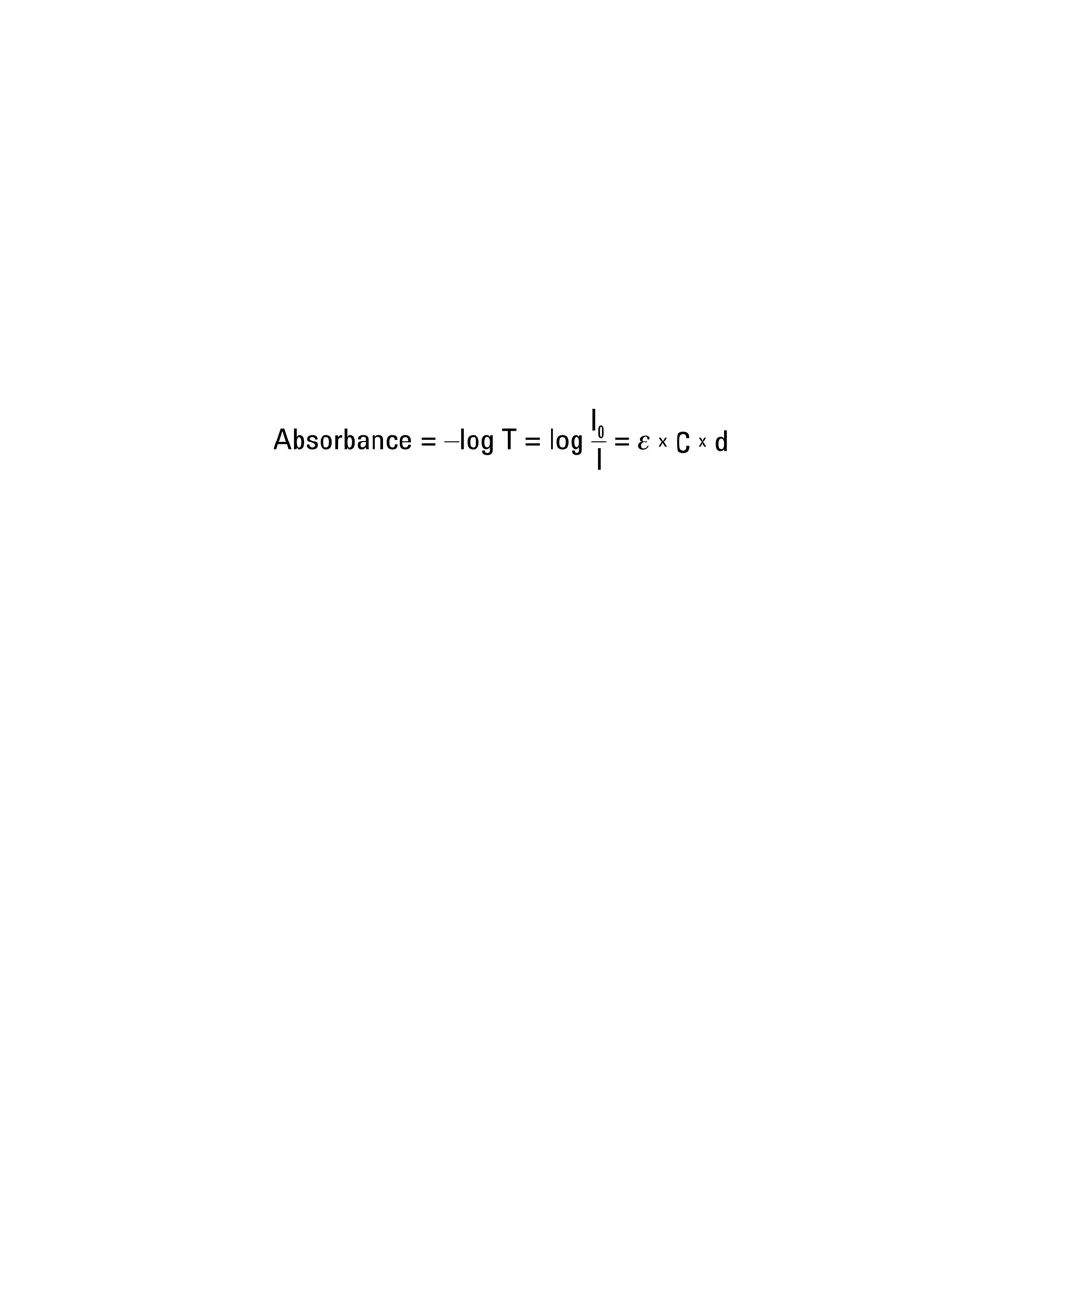
Lambert-Beer’s law shows a linear relationship between the flow cell path
length and absorbance.
where
T is the transmission, defined as the quotient of the intensity of the
transmitted light I divided by the intensity of the incident light, I
0
,
ε is the extinction coefficient, which is a characteristic of a given substance
under a precisely-defined set of conditions of wavelength, solvent,
temperature and other parameters,
C [mol/L] is the concentration of the absorbing species, and
d [cm] is the path length of the cell used for the measurement.
The detector can now output the signal in two forms:
1 In Absorbance divide by the path length AU/cm, that is then similar to [ε x
C]. Advantage: samples with same concentration have same peak height
also at cells with different path lengths.
The upper limit of concentration: the linearity limit of the detector is then
seen at about 2 AU/path length, so for the 6 cm Max-Light Cartridge Cell the
linearity limit is 333 mAU/cm].
2 In AU that is equal to ε x C x d like normal done in the past: now for
recalculation to your concentration C the path length must be considered.
Therefore, flow cells with longer path lengths yield higher signals. Although
noise usually increases little with increasing path length, there is a gain in
signal-to-noise ratio.
When increasing the path length, the cell volume could increase. Depending on
the peak volume, this could cause more peak dispersion.
 Loading...