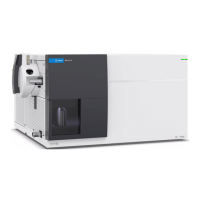
Histogram
The same color scheme applies to histograms. In the image below, the green vertical lines that separate the black
histogram background from the light red limit areas indicate that limits have not been exceeded.
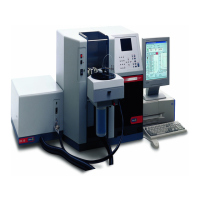
In the image below, the lower (left) limit border is red, indicating that the lower limit has been exceeded. Note that the
reading in the upper left corner (-01.68487 VDC) is within limits, so it is not red.
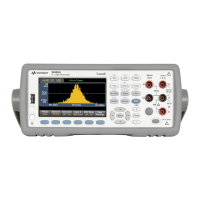
Bar Meter
The bar meter (below) uses the same color scheme. The green limit border on the left indicates that the lower limit has
not been exceeded, and the red limit border on the right indicates that the upper limit has been exceeded. The
numbers 0 and 259 below the light red limit areas indicate how many times each limit has been exceeded, and the
word FAIL indicates that a limit has been exceeded.
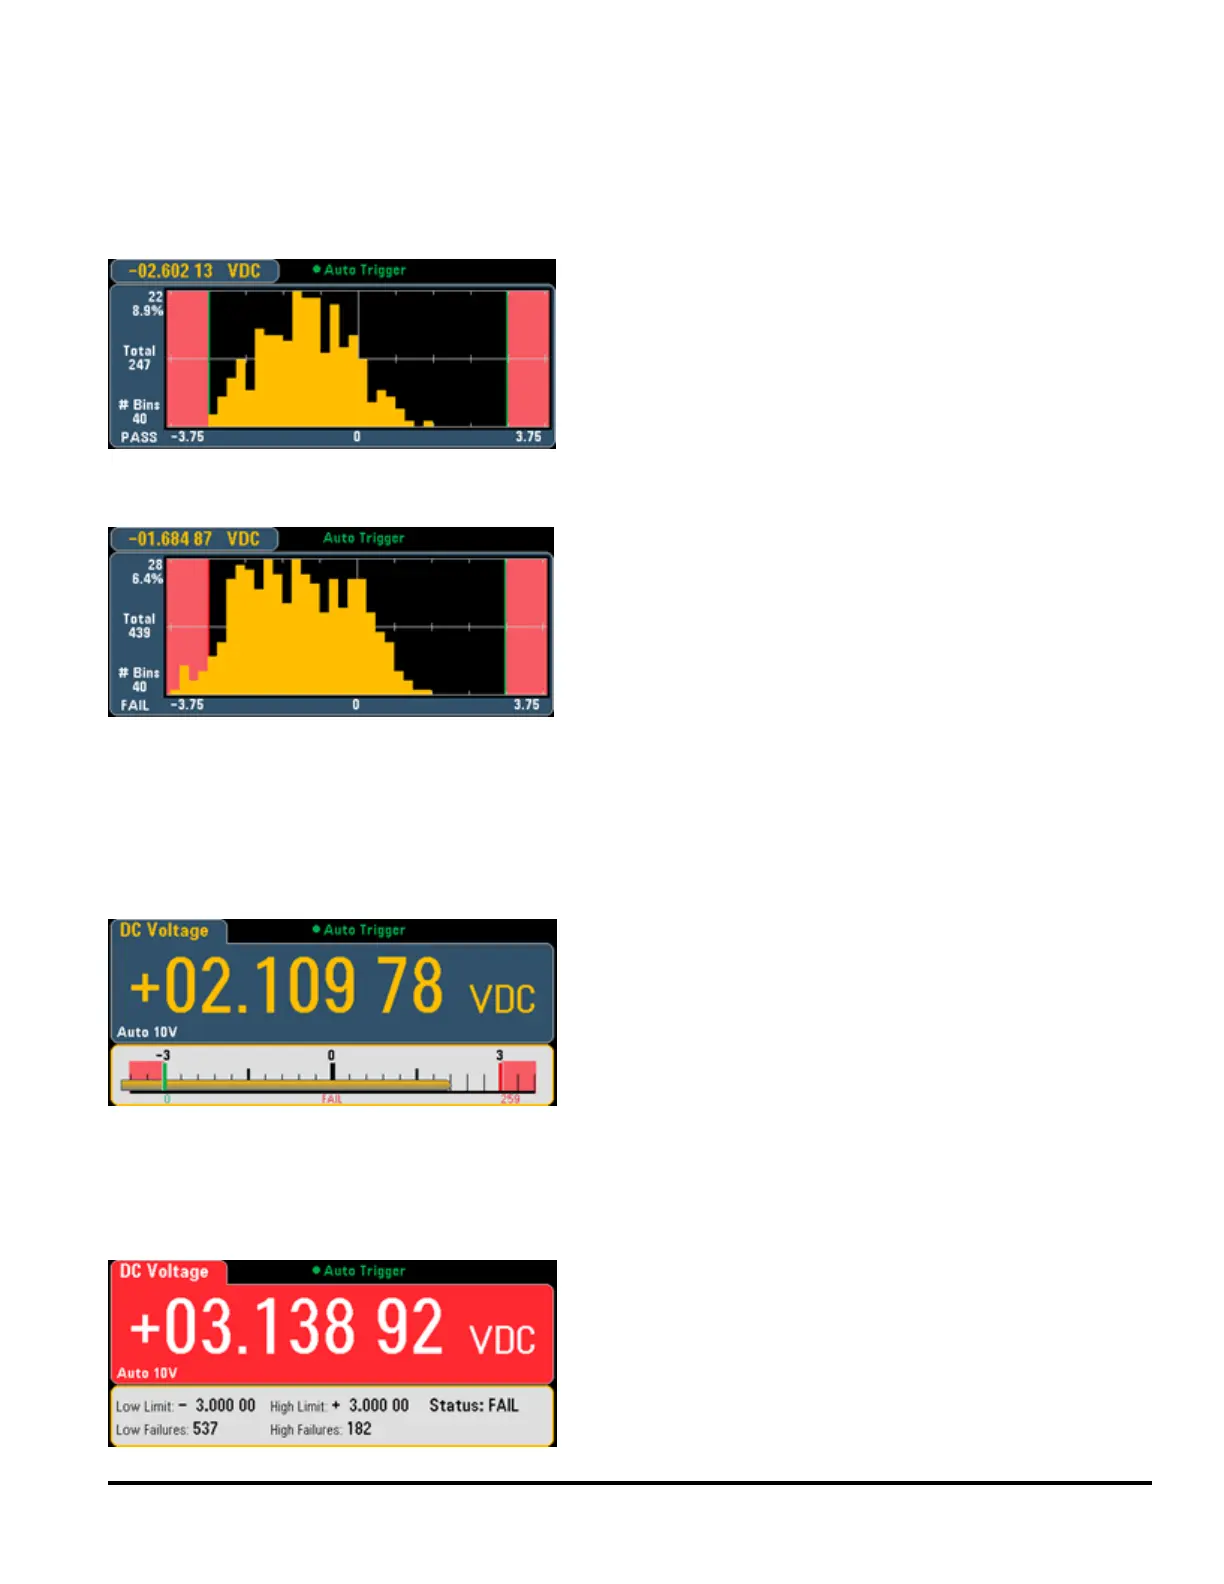
Number
The bright red color (shown below) indicates that the displayed measurement exceeds the limits. The Number display
also indicates how many times the limits have been exceeded.
Agilent Truevolt Series DMM Operating and Service Guide 59
 Loading...