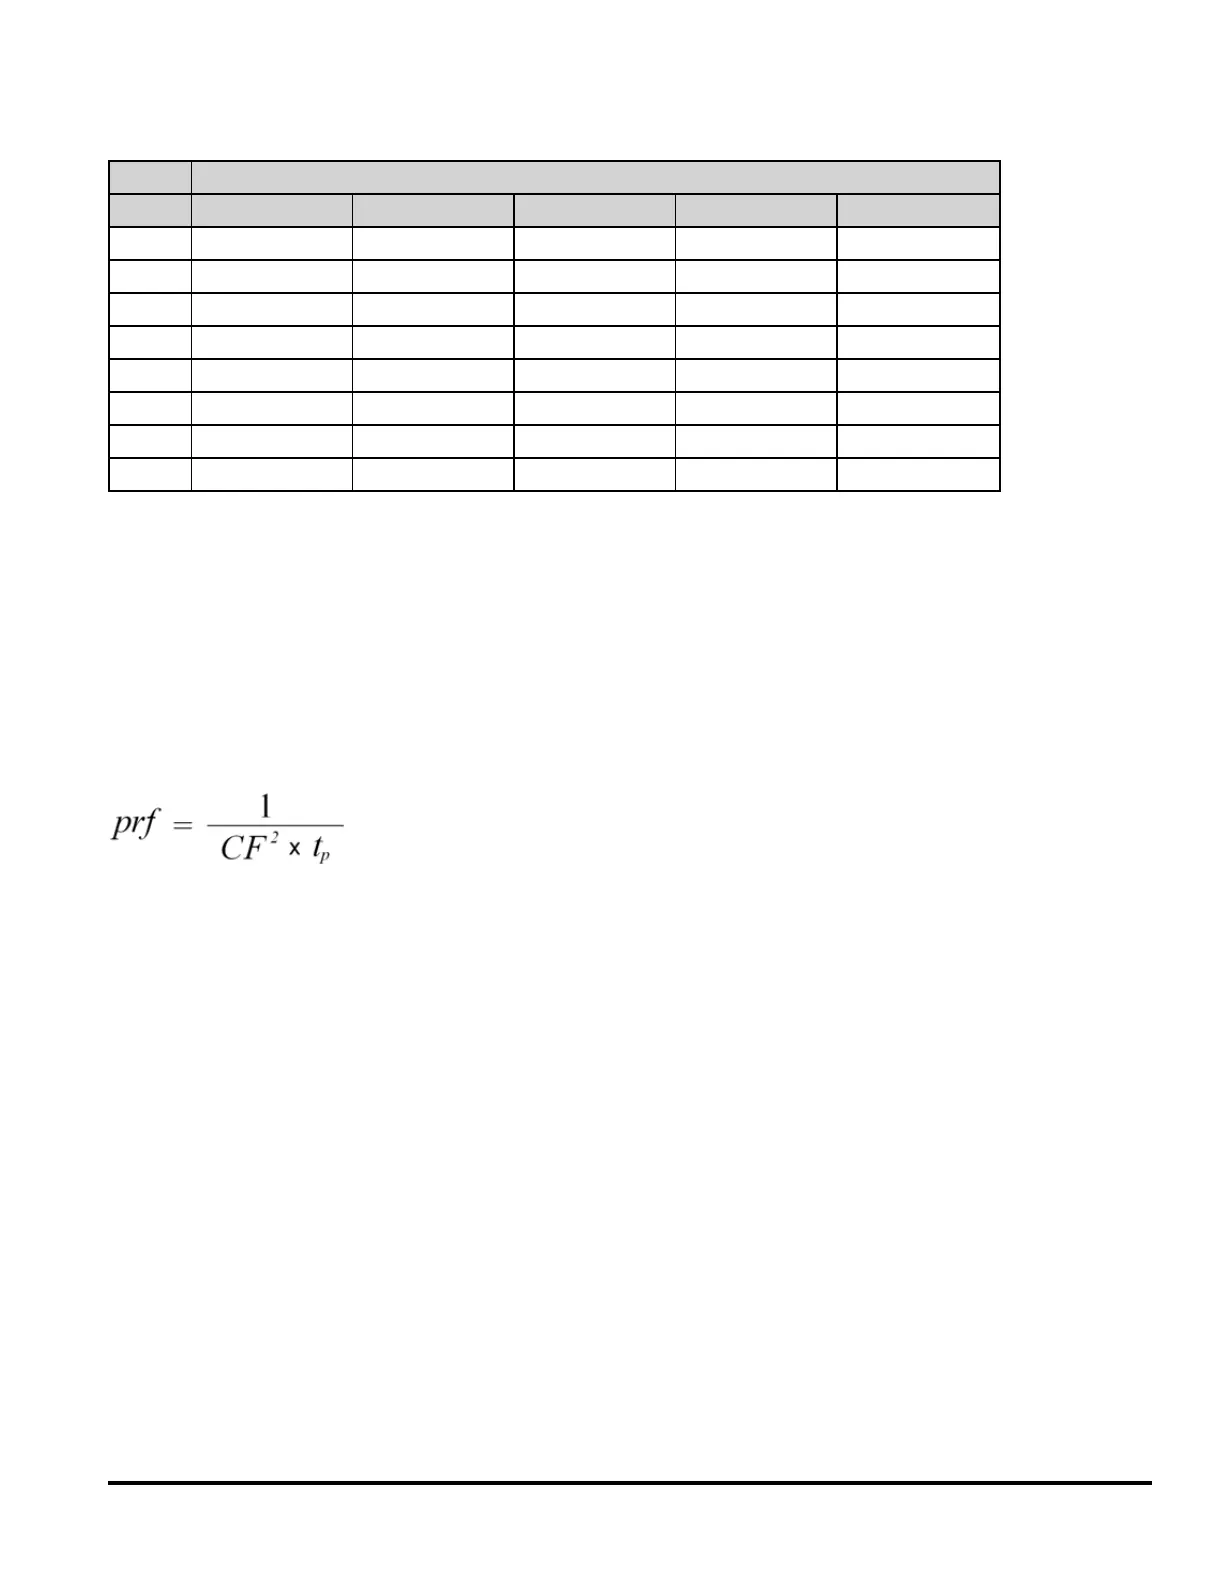
The following table shows the typical error for various pulse waveforms as a function of input pulse frequency:
Typical error for square wave, triangle wave, and pulse trains of CF=3, 5, or 10
prf square wave triangle CF=3 CF=5 CF=10
200 -0.02% 0.00% -0.04% -0.09% -0.34%
1000 -0.07% 0.00% -0.18% -0.44% -1.71%
2000 -0.14% 0.00% -0.34% -0.88% -3.52%
5000 -0.34% 0.00% -0.84% -2.29% -8.34%
10000 -0.68% 0.00% -1.75% -4.94% -26.00%
20000 -1.28% 0.00% -3.07% -8.20% -45.70%
50000 -3.41% -0.04% -6.75% -32.0% -65.30%
100000 -5.10% -0.12% -21.8% -50.6% -75.40%
This table gives an additional error for each waveform, to be added to the value from the accuracy table provided in the
instrument's data sheet
The specifications are valid for CF ≤ 10, provided there is insignificant signal energy above the 300 kHz bandwidth for
voltage, or the 10 kHz bandwidth for current. Multimeter performance is not specified for CF > 10, or when significant
out-of-band signal content is present.
Example
A pulse train with level 1 Vrms, is measured on the 1 V range. It has pulse heights of 3 V (that is, a Crest Factor of 3)
and duration 111 µs. The prf can be calculated to be 1000 Hz, as follows:
Thus, from the table above, this AC waveform can be measured with 0.18 percent additional error.
Agilent Truevolt Series DMM Operating and Service Guide 93
 Loading...