Section 6 Correction Software
6-22
Confirmation of measured results by following the instructions below.
(1) Select “Graph Check” in section [3] on the “Initial Menu Screen” shown in Fig.
6-4. This causes the “Measured result Confirmation Screen,” shown in Fig. 6-18,
to appear together with the currently set specification data.
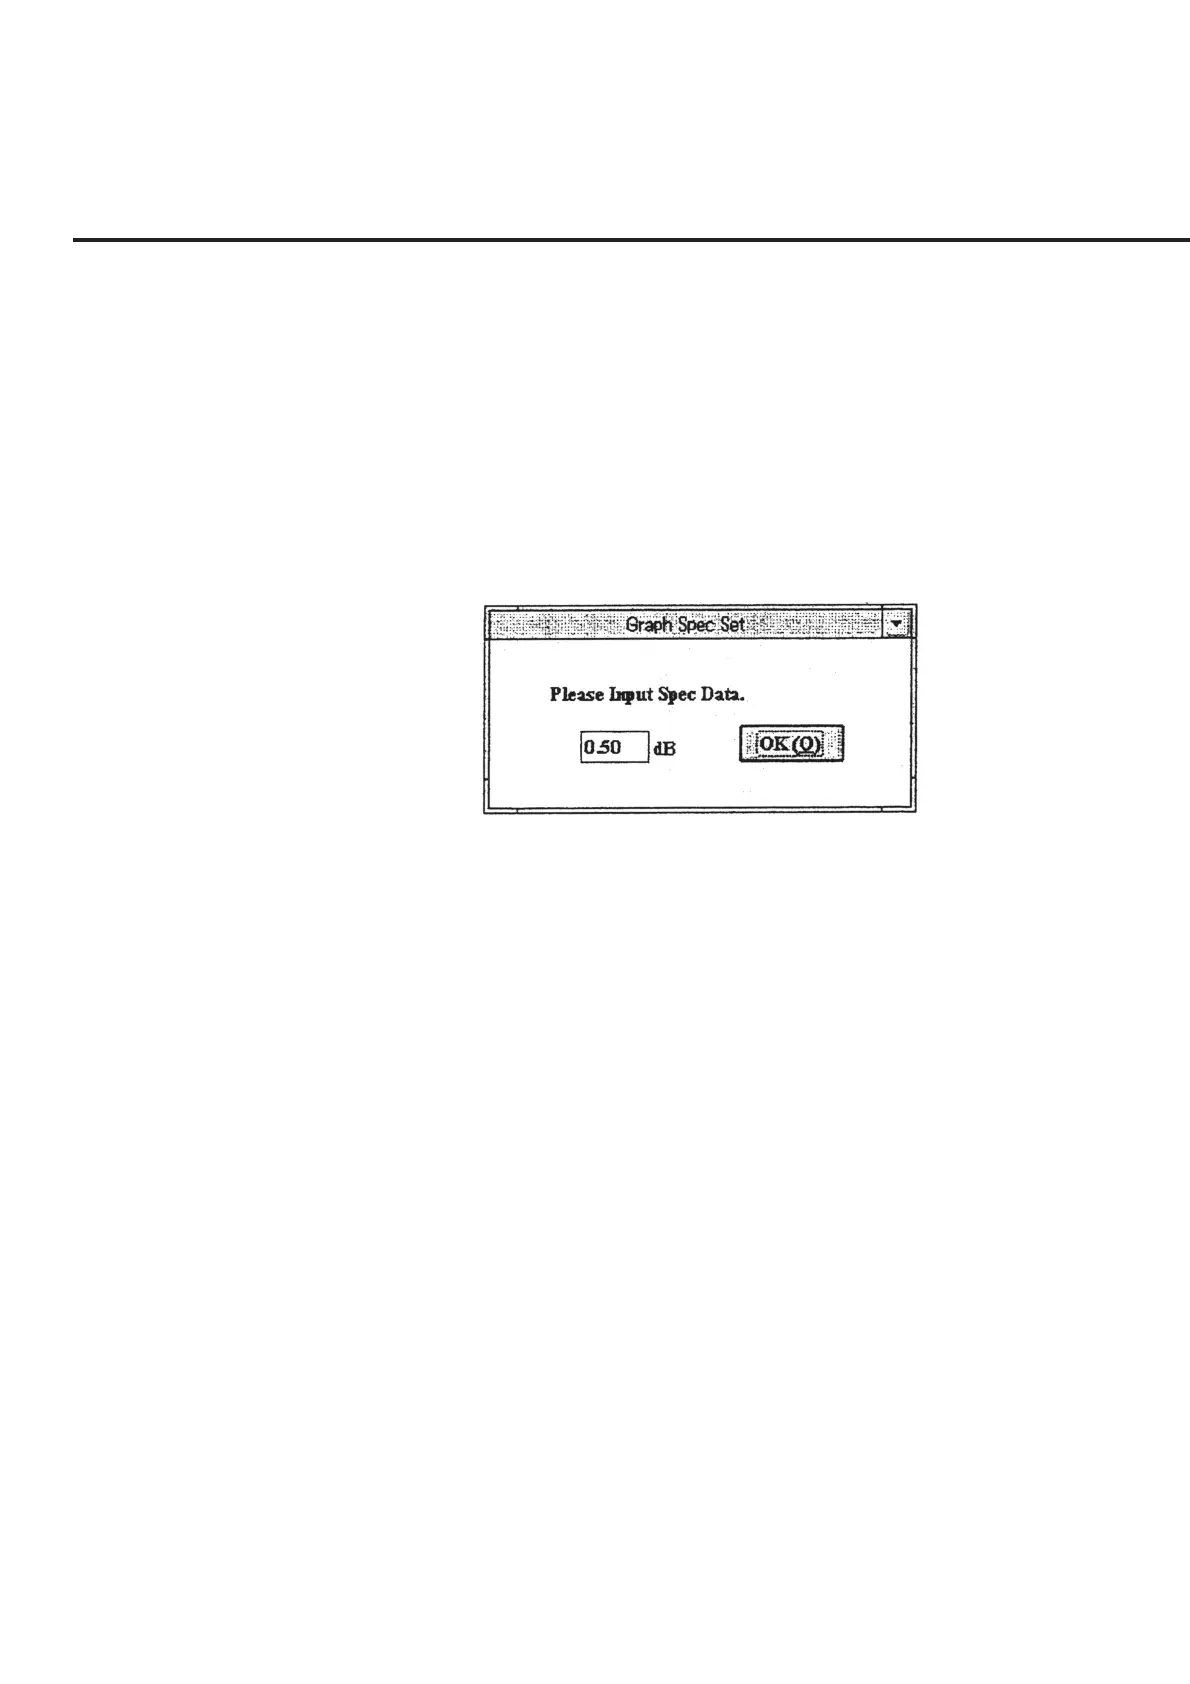
(2) Check the specification data displayed in section [3] and select “File” –– “Spec
Set” in section [1] to change the data. This causes the “Specification Data Input
Screen,” shown in Fig. 6-19, to appear. Modify the set data displayed and click
the “OK” button. The data set is displayed in section [3]. The range of input data
allowed is between 0.01 and 9.99.
Fig. 6-19 Specification Data Input Screen
(3) Specify a file name whose data you wish to check. Select “File” –– “Select” in
section [1]. This causes the “Data File Selection Screen,” shown in Fig. 6-20, to
appear. Select a data file you wish to check. See 6.6.8 “Selecting Data File” for
more information on the selection of files.
(4) When a file has been selected, the data file name selected is displayed in section
[2], and the data stored is displayed by graph in section [4]. The following colors
are used for the graph display:blue for “.TXT” type data (correction value of
DUT) and pink for “.DAT” type data (measured results of the frequency re-
sponse).
(5) Select “File” –– “Exit” in section [1] to exit from the screen. This causes the
screen to return to the “Initial Menu Screen” shown in Fig. 6-4.