6-21
6.6 Operation
6.6.7 Confirmation of Measured results
When “Graph Check” in section [3] is selected on the “Initial Menu Screen,” shown in
Fig. 6-4, the “Measured result Confirmation Screen,” shown in Fig. 6-18, is displayed
together with the default specification data. This program enables confirmation of the
data by graph based on the measurement data (the output data file) of the DUT for
which correction or frequency response measurement has been completed. The fol-
lowing section shows the names of control functions on this screen as well as outline of
these functions.
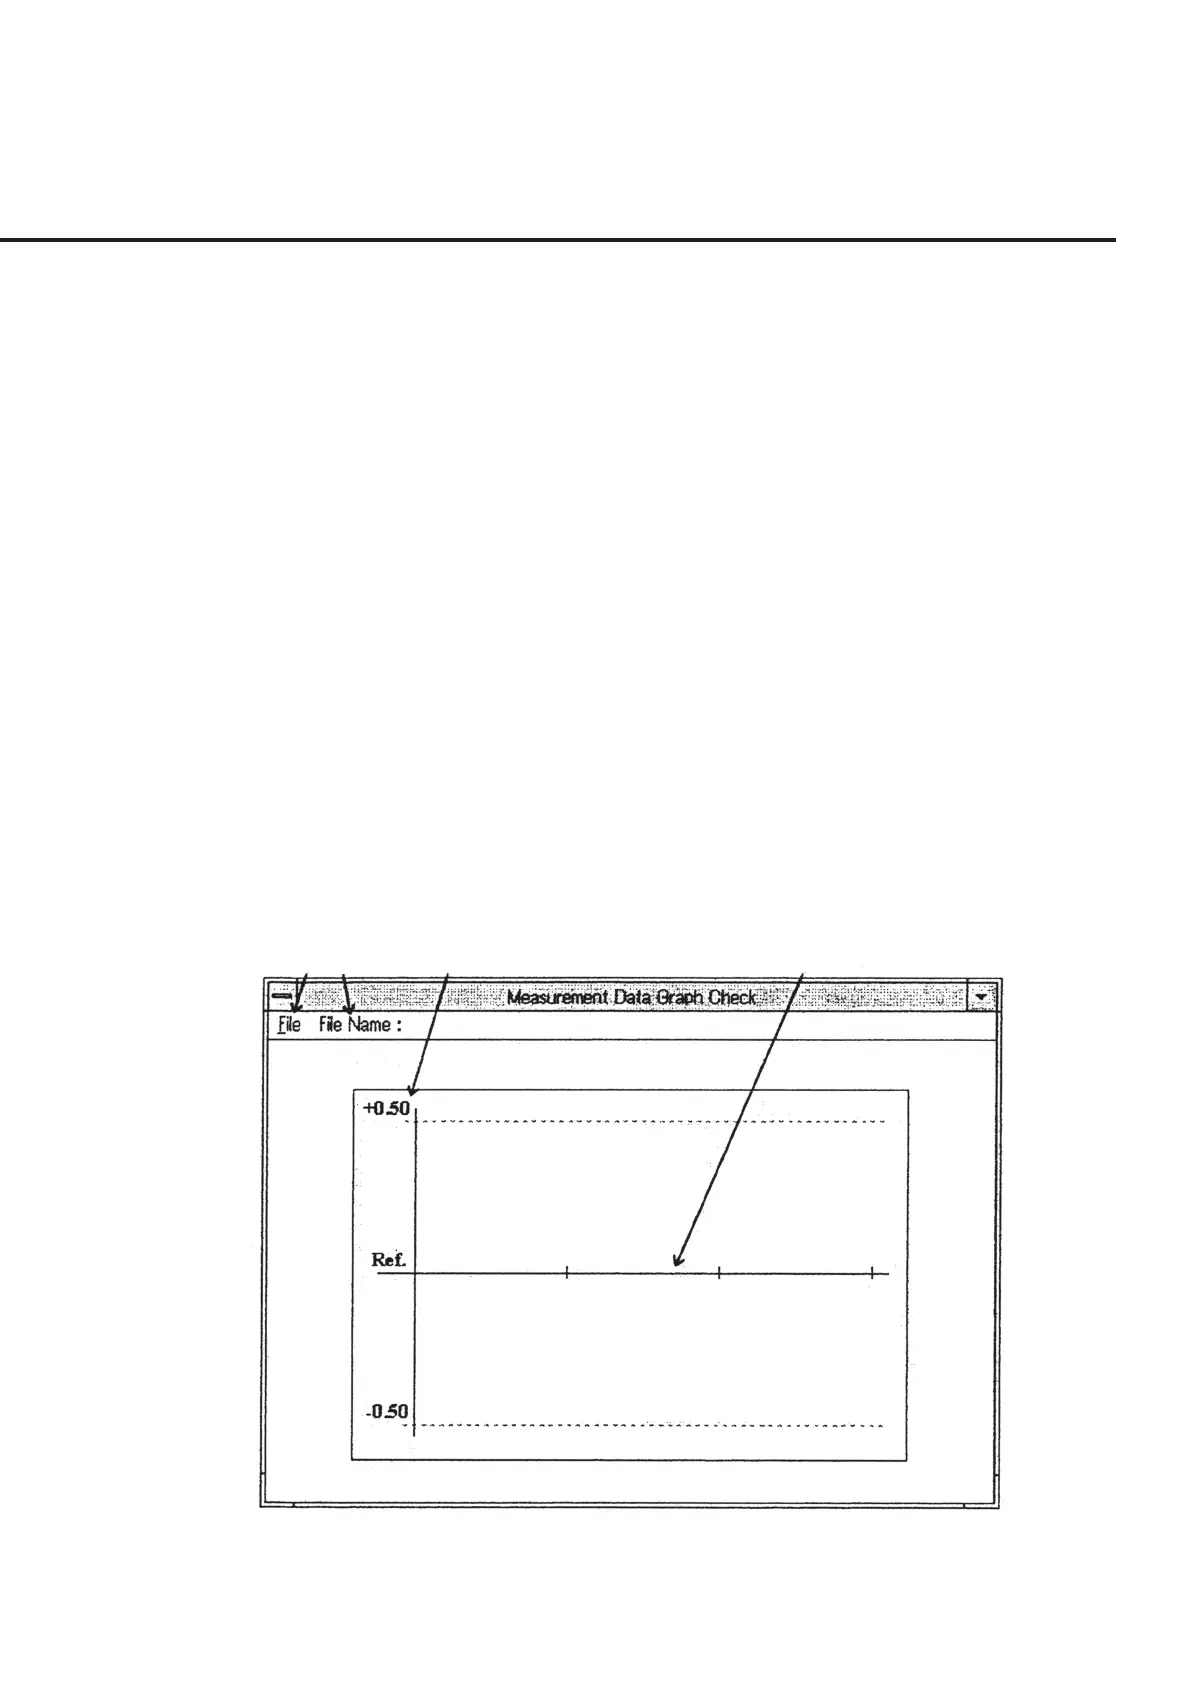
[1] File (“File” section) This section is used to select a file name, set the specification data displayed in section
[3] and return to the “Initial Menu Screen” shown in Fig. 6-4.
[2] File Name (File name display section)
This section displays the data file name selected by “File” - “Select” in section [1].
[3] Specification data display section
This section displays the specification data currently set. “File” in section [1] is used to
modify the value.
[4] Measured results display section
This section displays the data of the file selected by “File” - “Select” in section [1] by
graph.
[1] [2] [3] [4]
Fig. 6-18 Measured result Confirmation Screen