Replacement
Behavior of replacement function
Setting Description
from
measurements
(continued)
W-Q measurements
Then enter values for date and measuring values for W and corresponding Q in table below
active / delete
> Tick checkbox to activate or delete value pair for W/Q curve.
Click Add new measurement to add new line to enter additional values.
Click Redraw to save settings. Values are displayed in the list above.
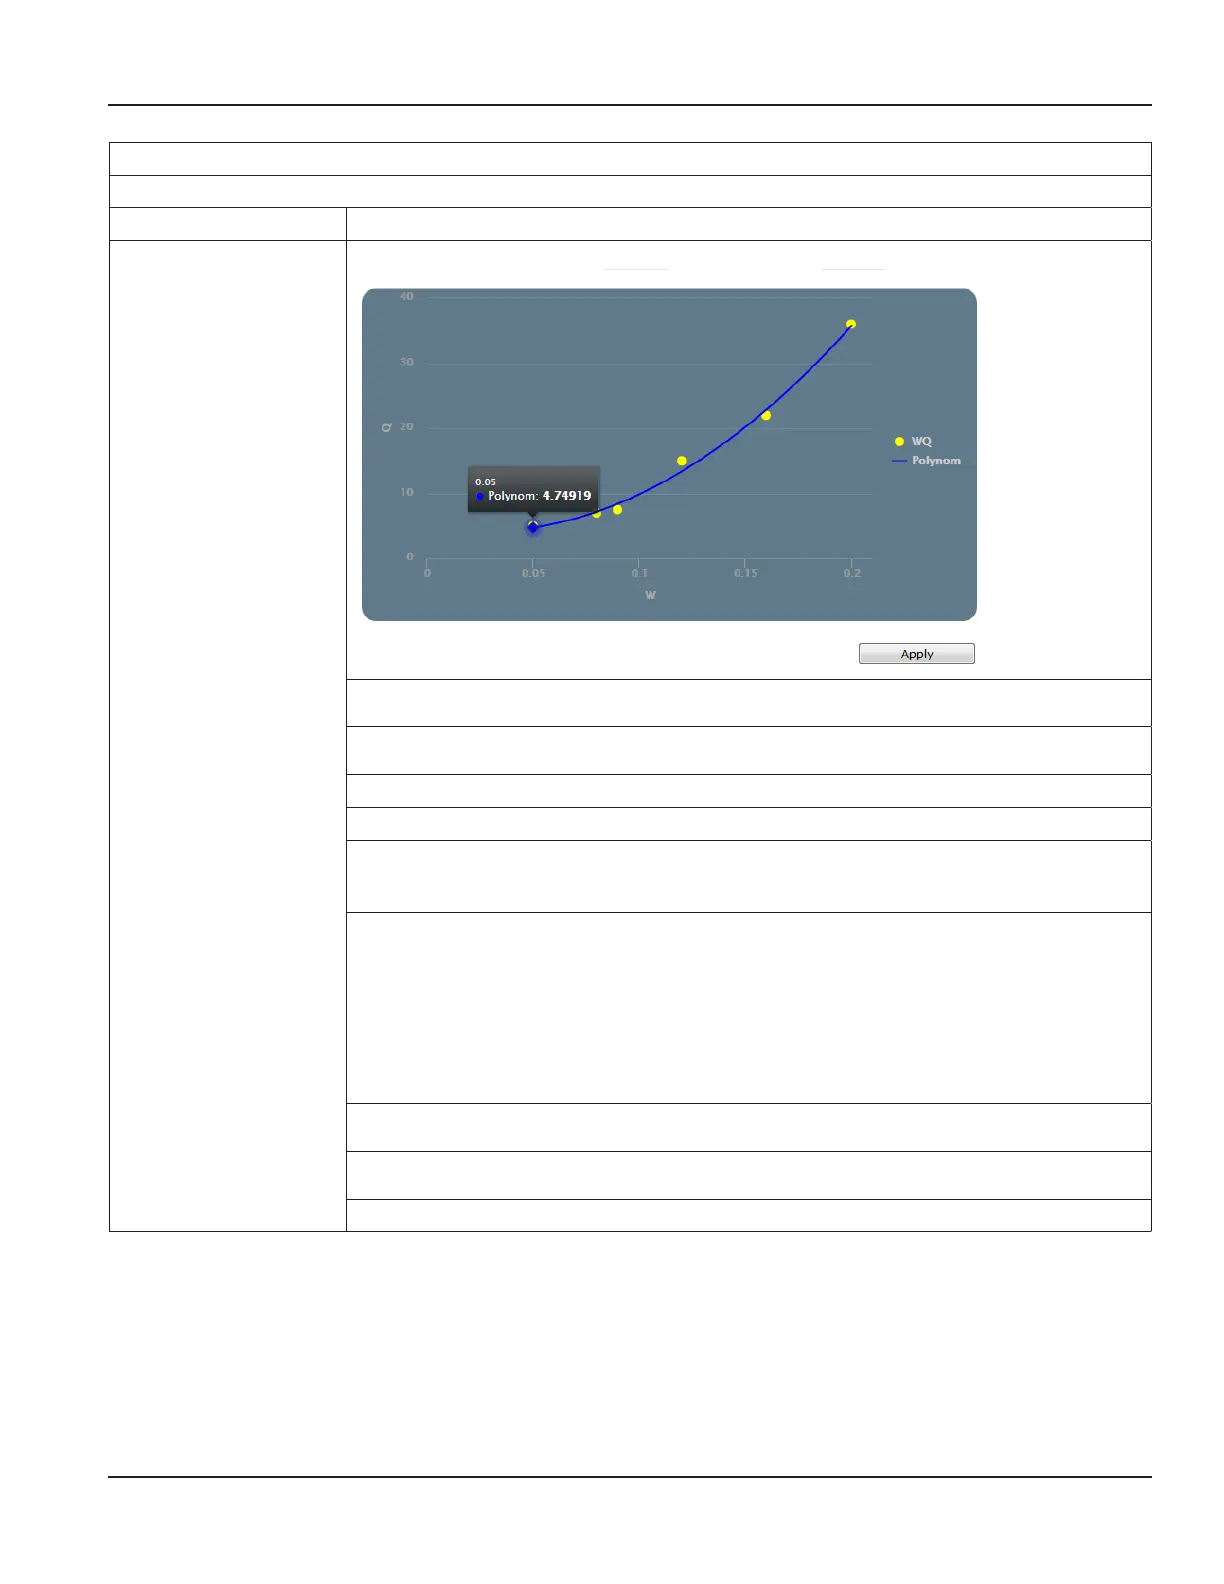
Curve fitting options
The pairs of value are plotted in W/Q graph for rating curve according to approximation
settings.
Fit:
linear
polynomial 2nd
(…)
The values and the discharge rating curve are plotted in a W/Q diagram. For curve fitting choose
linear or polynomials up to 6 degrees.
> Select reasonable curve fitting options from drop-down list.
W min / W max
> Enter minimum / maximum value for water level.
Q min / Q max
> Enter minimum / maximum value for discharge.
Click Apply to redraw graph.
Programming
Page 59 March 2021 HYB-UM-03155-EN-03
 Loading...