92 WaveRIDER
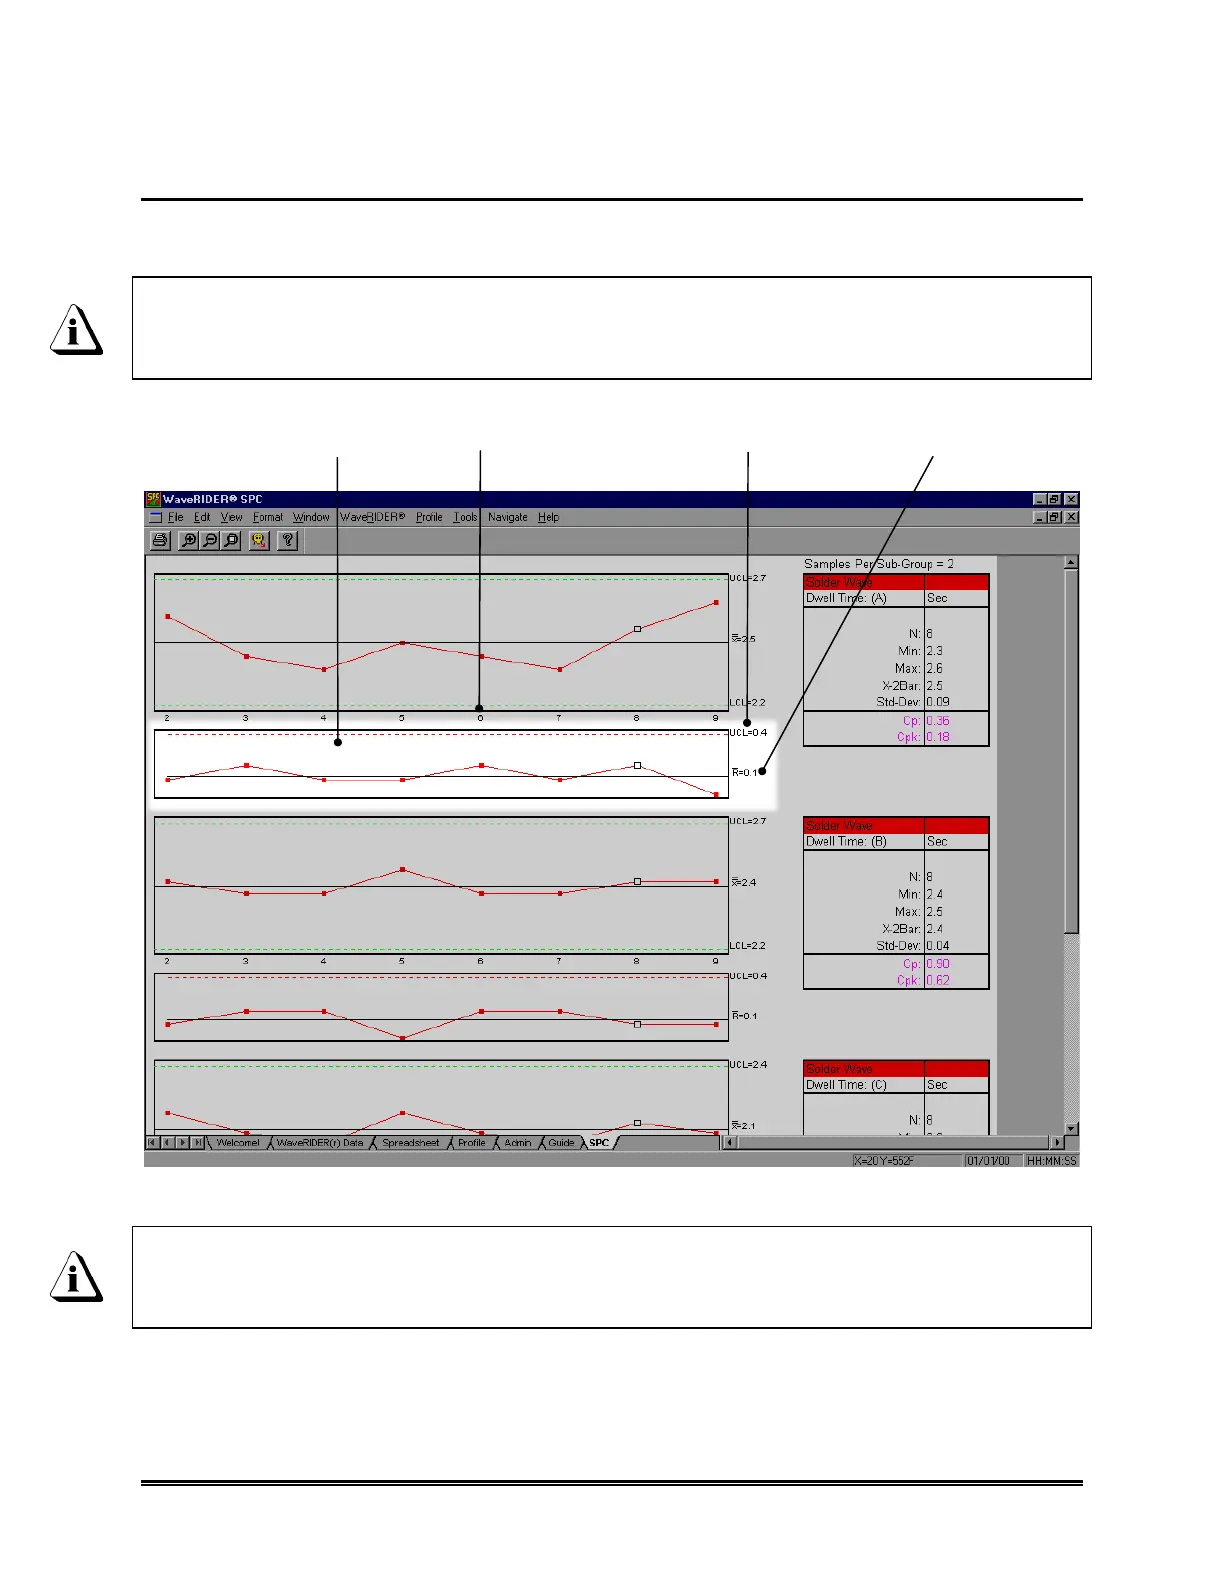
4.7.3 R Chart
The R Chart is the graphical chart produced from the selected parameter. The R-Bar is
the averages of the range samples.
If the Sub-Group size is set to 1, the R chart becomes a moving range (mR) chart.
The moving range is the difference between a specified X value and the one
preceding it.
Figure 4- 58: R Chart
The calculation numbers vary depending on the data in the Spreadsheet
worksheet. Using the filter function or the hide command allows the user to
select the specific data runs to include on the SPC chart.
CALCULATION
NUMBER
R CHART
UCL
R-BAR
 Loading...