WaveRIDER 137
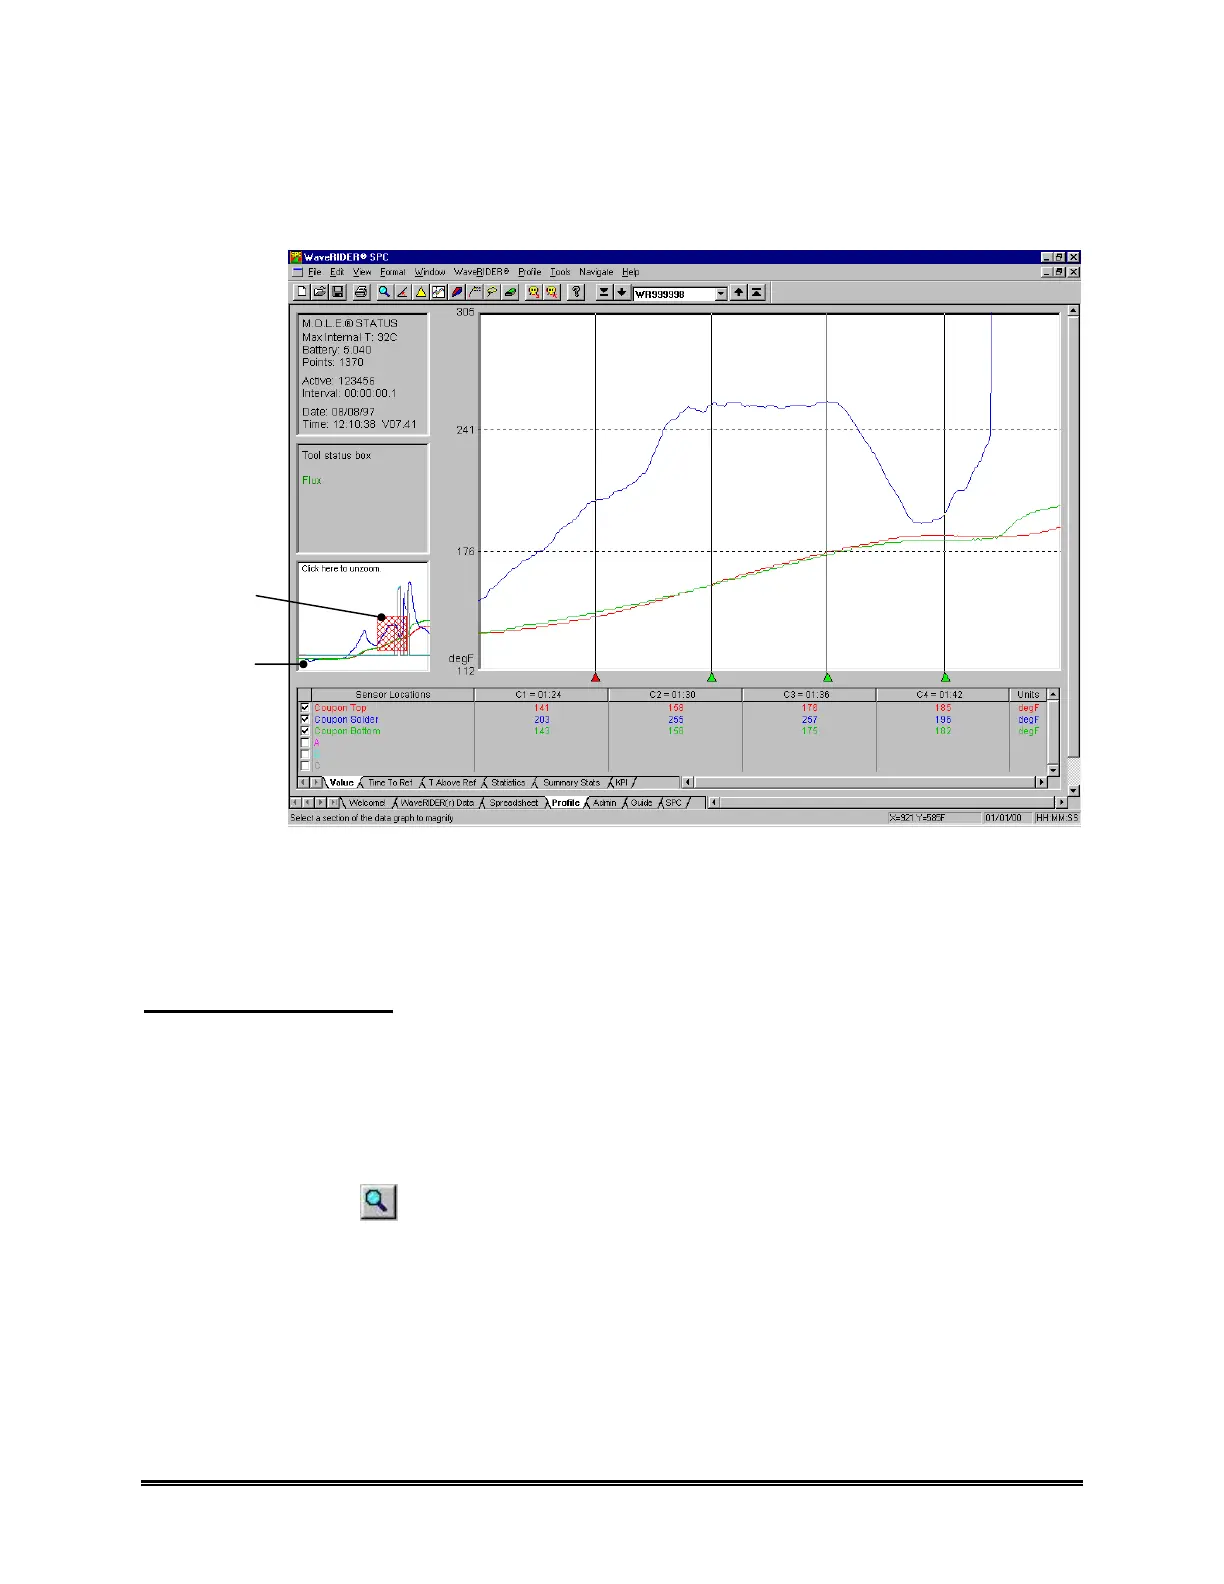
When using the Magnify tool, the Magnify Map uses a red box to indicate the area
currently magnified. If the Data Graph was previously magnified, the current level of
magnification is the red box and previous magnified areas are noted with gray boxes.
Figure 5- 42: Magnify Map
When the Magnify tool has been used multiple times, click a red box in the Magnify map
once to go back to a previously selected level of magnification or the white area to
return to the full view.
Magnify Applications:
Magnify is useful for visually examining data, when statistics are used. The statistics
(Value, Time to Ref., T Above Ref, and Statistics) compute only data points that fall
within the area of the Data Graph. This enables the user to focus the statistical analysis
on any portion of time, distance, or data point number in the graph.
The Magnify command can be accessed on the Profile worksheet Toolbar.
Magnify Button:
MAGNIFY
MAP
MAGNIFIED
AREA
 Loading...