WaveRIDER 157
Moving Average/Moving Range Chart Technique:
WaveRIDER SPC utilizes the standard Moving Average/Moving Range Charting
technique with a subgroup size of 2-6 that is selected by the user. The following steps
and figure illustrates the Moving Average/Moving Range calculations (using a group
size of two) that are used to construct the SPC chart.
Steps for Creating a Moving Average Moving Range Control Chart
1) Select the key variable to monitor.
2) Select the moving average group size. (We will use two in our example.)
3) Obtain your first sample and record it as sample 1 (X1).
4) Obtain your second sample and record it as sample 2 (X2).
5) Determine the x-bar and R values.
6) Plot this value on the chart as subgroup 1.
7) Carry forward sample 2 into subgroup 2’s calculation. Obtain your third sample
and record it as sample 3. The averages of sample 2 and sample 3 form
subgroup 2.
8) Plot this value on the chart as subgroup 2.
9) Repeat for all the samples.
10) Calculate control limits using standard x-bar and R formulas for the appropriate
sample sizes. WR SPC uses range-based calculations for LCL and UCL.
11) Continue monitoring the process.
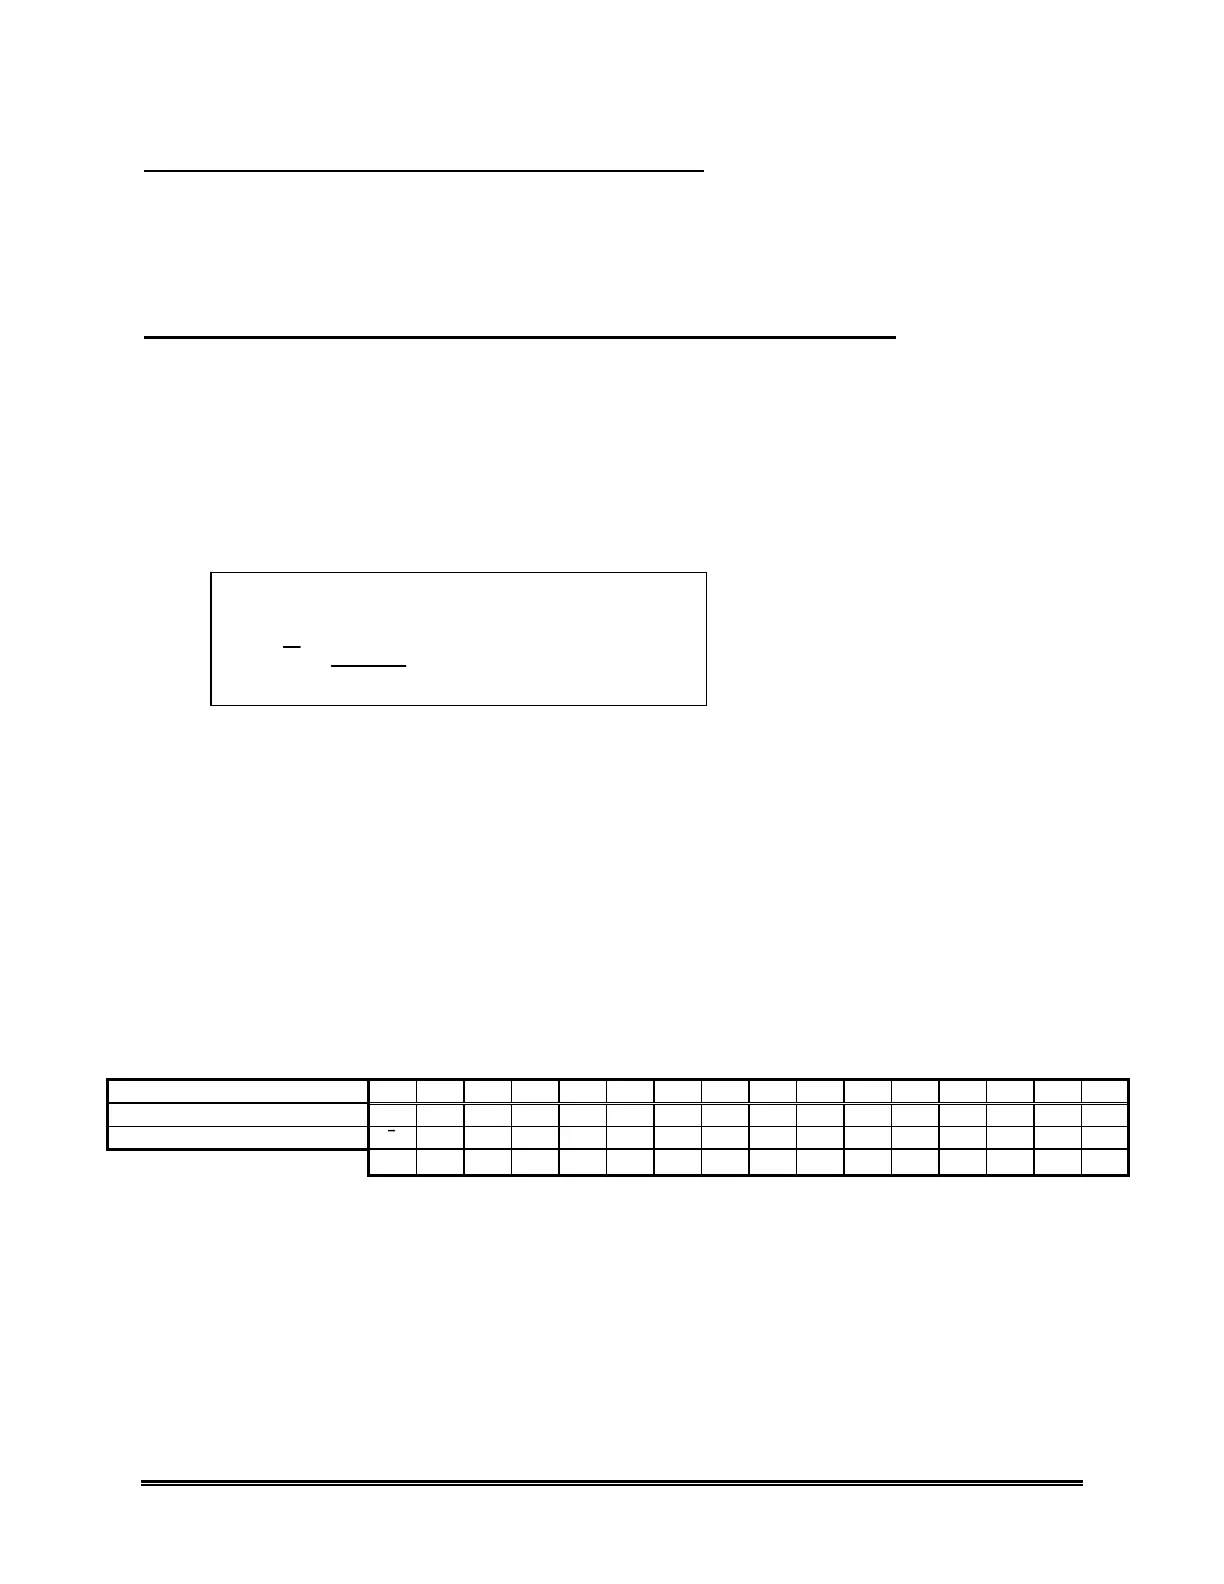
SAMPLE # 1 2 3 4 5 6 7 8 9 10 11 12 13 14 15 16
SAMPLE MEASUREMENTS 3 4 5 3 2 9 5 2 6 8 4 8 5 6 3 3
SUBGROUP VALUE x 3.5 4.5 4 2.5 5.5 7 3.5 4 7 6 6 6.5 5.5 4.5 3
R 1 1 2 1 7 4 3 4 2 4 4 3 1 3 0
Figure A-1: Moving Average/Moving Range Subgroup Size 2 Calculations Chart
Moving Average formulas:
Ran
e
R=X - X
H
L
X1 + X2
2
X =

 Loading...