WaveRIDER 187
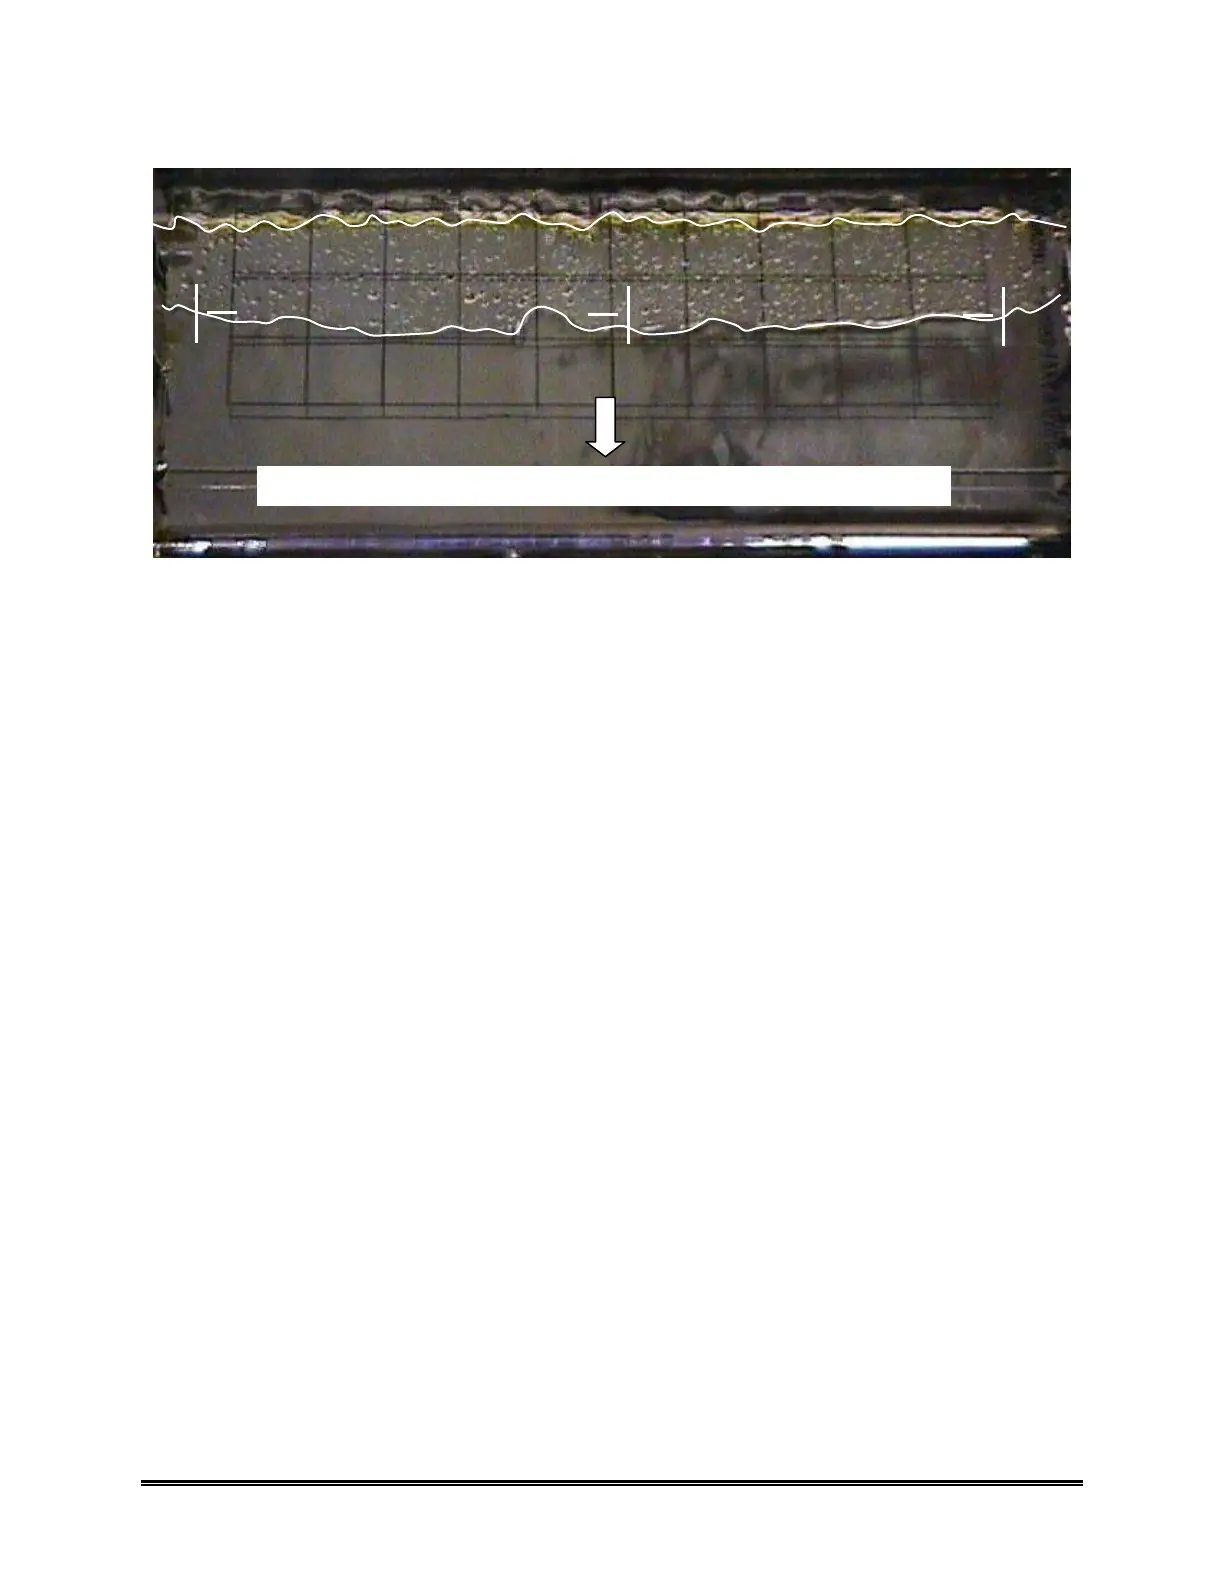
Figure C-9: Typical Wave Crest
The crest of the wave is highlighted to make is more visible. As you can see, the edge is
very rough and is constantly changing shape as it progress across the board. It is also
noticed that the sides of the wave tend to be narrower then the middle. Based on this
snap-shot, one would expect this wave to read parallel with sensors “A” and “C” reading
lower contact times then “B.” This high in the middle observation is typical in many
waves and is not because the glass bent down in the middle. It is most likely due to
increased pumping action near the center of the wave, which may also be causing the
increased ripple action near the center as seen in the first wave illustration. Also, with
this typical wave dynamics one should expect successive measurements to have some
variation. In the above illustration, at 4 ft/min conveyor speed, one can expect up to 0.8
seconds variation from sensor to sensor.
The real issue in making exact measurements from your solder wave is to determine
what your solder process can tolerate, and not so much to make the solder processes
perfect. Clearly some parameters are more important such as conveyor speed, solder
temperature, and preheat slopes, but to expect a pumped liquid as dense as solder to
behave with perfect geometry is asking a bit much from the machine manufacture. If
your solder process is not producing good results, a measurement tool will quickly point
out the problem. But the goal of measuring a good process over and over is to obtain
data which can be used to determine how much variation is acceptable and help predict
when a good process is going bad.
Direction of Conveyor
Typical wave crest pattern as viewed through a tempered glass plate
A
B C
 Loading...