WaveRIDER 67
Key Process Indicators Setup:
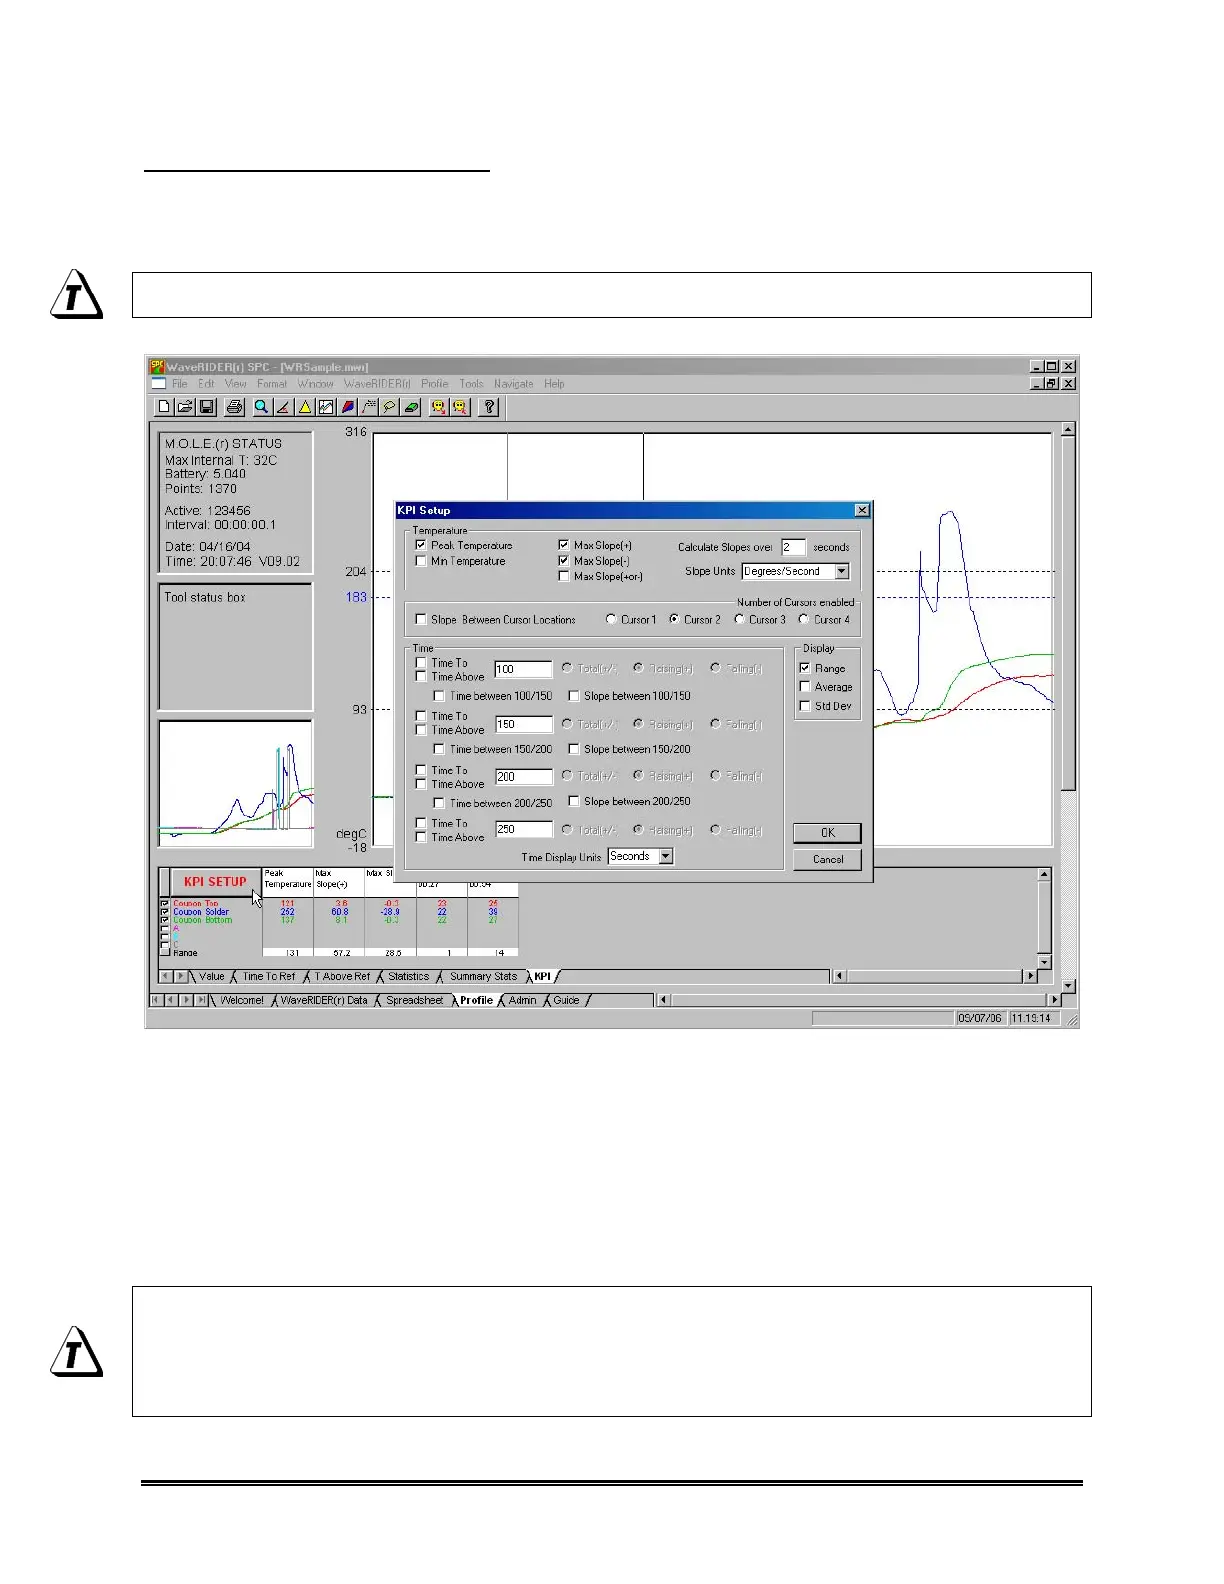
1) Make sure the KPI Data Tab is active.
2) Click the KPI Setup button above the Sensor Locations descriptions.
The KPI Setup can also be activated by right-clicking a column header.
Figure 4- 36: KPI Setup
3) Click the desired parameters to display in the Data Table. The parameters are
grouped by Temperature, Cursor data with slope between, and Time. The user
can also select to display Range, Average and Standard Deviation rows for each
of the columns.
4) When finished select the OK button to display the new settings or Cancel to return
to the worksheet without making any changes.
A maximum of 12-16 parameter columns can be displayed at one time. As
columns populate the Data Table, they are automatically sized to fit. It is
recommended that the most beneficial column information is displayed to
achieve the best results.
 Loading...