EasyManuals Logo

ECD WaveRIDER Series User Manual

ECD WaveRIDER Series
202 pages
To Next Page IconTo Next Page
To Previous Page IconTo Previous Page
Page #83 background imageLoading...
Page #83 background image
72 WaveRIDER
4.4.10.5 X-Cursors
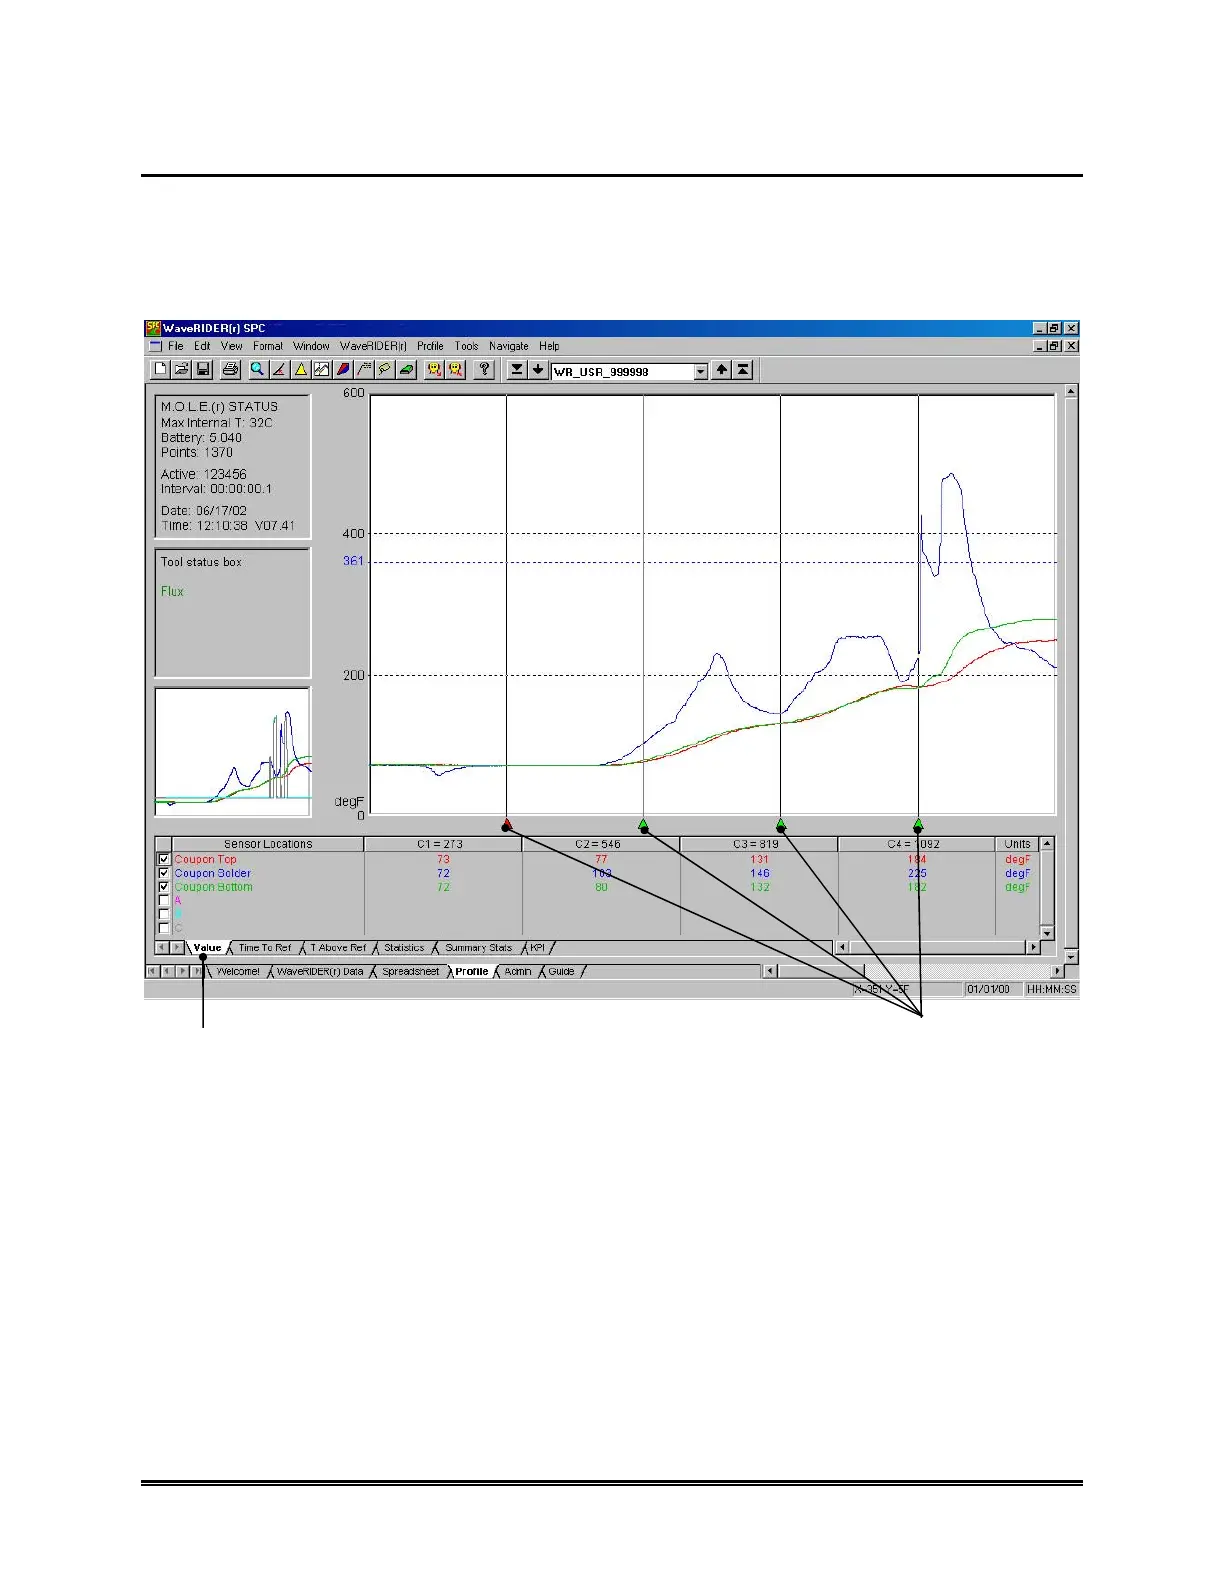
The Data Graph has four X-cursors that indicate the temperature values at the
intersection of a Data Plot with each X-cursor. When the Value Data Tab is selected,
these values are displayed in the Data Table in four data columns labeled C1, C2, C3,
and C4, representing X-cursor 1 through X-cursor 4 respectively.
Figure 4- 39: X-Cursors
X-CURSORS
VALUE STATISTICS TAB

Table of Contents

Questions and Answers:

Question and Answer IconNeed help?

Do you have a question about the ECD WaveRIDER Series and is the answer not in the manual?

ECD WaveRIDER Series Specifications

General IconGeneral
BrandECD
ModelWaveRIDER Series
CategoryMeasuring Instruments
LanguageEnglish

Related product manuals