TÜV Rheinland Energie und Umwelt GmbH
Air Pollution Control
Report on the performance testing of the Serinus 30 ambient air quality moni-
toring system manufactured by Ecotech Pty Ltd measuring CO,
Report no.: 936/21221977/D_EN
Page 9 of 253
EP_Ecotech_Serinus30_en.docx
List of figures
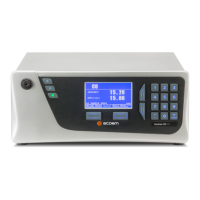
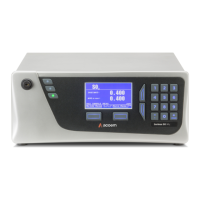
Figure 1: Representation of the Serinus 30 analyser ......................................................23
Figure 2: Illustration of the theoretical measurement method within the cell ....................24
Figure 3: Gas filter correlation wheel ...............................................................................25
Figure 4: Internal components of the Serinus 30 measuring system ...............................26
Figure 5: Internal view of the Serinus 30 measuring system ...........................................27
Figure 6: Pneumatic circuit diagram of the Serinus 30 measuring system .......................31
Figure 7: Rear panel of the Serinus 30 ...........................................................................42
Figure 8: Display of the software version (2.09.0005) on the start screen .......................52
Figure 9: Diagram illustrating the response time .............................................................72
Figure 10: Function established from group averages for system 1, component CO ........84
Figure 11: Function established from group averages for system 2, component CO ........85
Figure 12: Concentration variation for the averaging test (t
CO
= t
zero
= 45 s).................... 100
Figure 13: Illustration of the reproducibility standard deviation under field conditions ..... 108