157
FIS Viewer
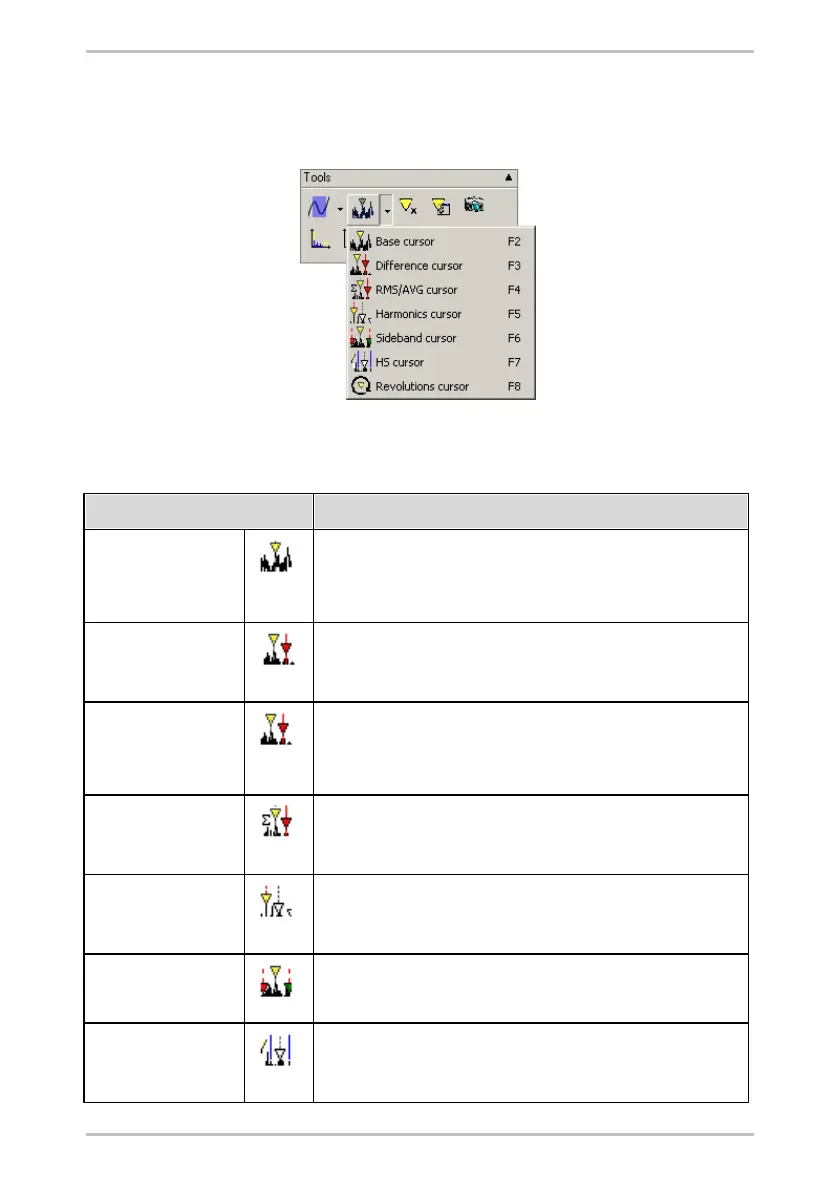
cursor tools. Depending on the type of diagram which has been opened
appropriate cursor tools are made available which can be used to obtain
individual measuring and characteristic values directly from the diagram.
Information on the current cursor is displayed above the diagram. You can show/
hide these value fields and the cursor by clicking on the cursor tool symbol that is
currently active.
Base cursor
(FFT, time signals,
Trend data)
You can use the base cursor to determine the measured values on
the x- and y-axis of a measuring point.
Measure cursor
(Time signals)
You can use the measure cursor to calculate the difference, the
effective value (root mean spare) and the arithmetic mean between
two measured values as well as the minimum/maximum value.
Difference cursor
(FFT, time signals,
Trend data)
You can use the difference cursor to calculate the difference
between two measured values.
RMS/AMV cursor
(FFT, time signals)
You can calculate the effective value (root mean square) and the
arithmetic mean between two measuring points using the RMS/AMV
cursor.
You can use the harmonic cursor to determine measured values at
points in the diagram where harmonics (multiples of the basic
frequency) are likely to occur.
You can use the sideband cursor to determine additional measured
values in definable sidebands starting from the base cursor.
The HS cursor (Harmonic with Sidebands) combines both cursor
types described above which means that both the harmonics and
their sidebands will be displayed.